
When it comes to load testing software, choosing the right tool is crucial for ensuring optimal application performance under heavy traffic. Locust is a Python-based, scalable, and developer-friendly load testing tool that enables you to simulate thousands of concurrent users and analyze system performance in real-time.
Unlike traditional load testing tools that rely on heavy scripting and GUI-based test execution, Locust load testing offers a lightweight, code-driven approach. It allows testers to define user behavior using simple Python scripts, making site load testing flexible and efficient. Whether you are testing APIs, web applications, or microservices, Locust provides accurate load generation to help identify bottlenecks before they impact real users.
If you're looking for a powerful yet easy-to-use software testing service, this guide will walk you through Locust’s key features, setup process, and best practices for effective load tests. Let’s dive in!
What You’ll Discover in This Blog
📌 Introduction to Locust – Learn why it’s a preferred load testing tool for modern applications.
📌 Setting Up Locust for Load Testing – A step-by-step guide to installing and running your first test.
📌 Defining User Behavior in Locust – Create realistic test scenarios to evaluate user behavior.
📌 Executing Load Tests with Locust – Learn how to simulate concurrent users and monitor real-time performance.
📌 Best Practices for Effective Load Testing – Optimize site load testing with proven strategies.
By the end of this guide, you'll have a solid understanding of Locust, how to leverage it for high-performance testing, and ensure your applications can handle real-world traffic seamlessly. Let’s get started! 🚀
What is Locust and Why is it Popular for Load Testing?
Locust is a Python-based load testing tool designed to test how well applications handle high traffic. Unlike traditional testing tools, which often come with complex interfaces, Locust uses a lightweight locust server to generate real-time test results while keeping things simple and efficient.
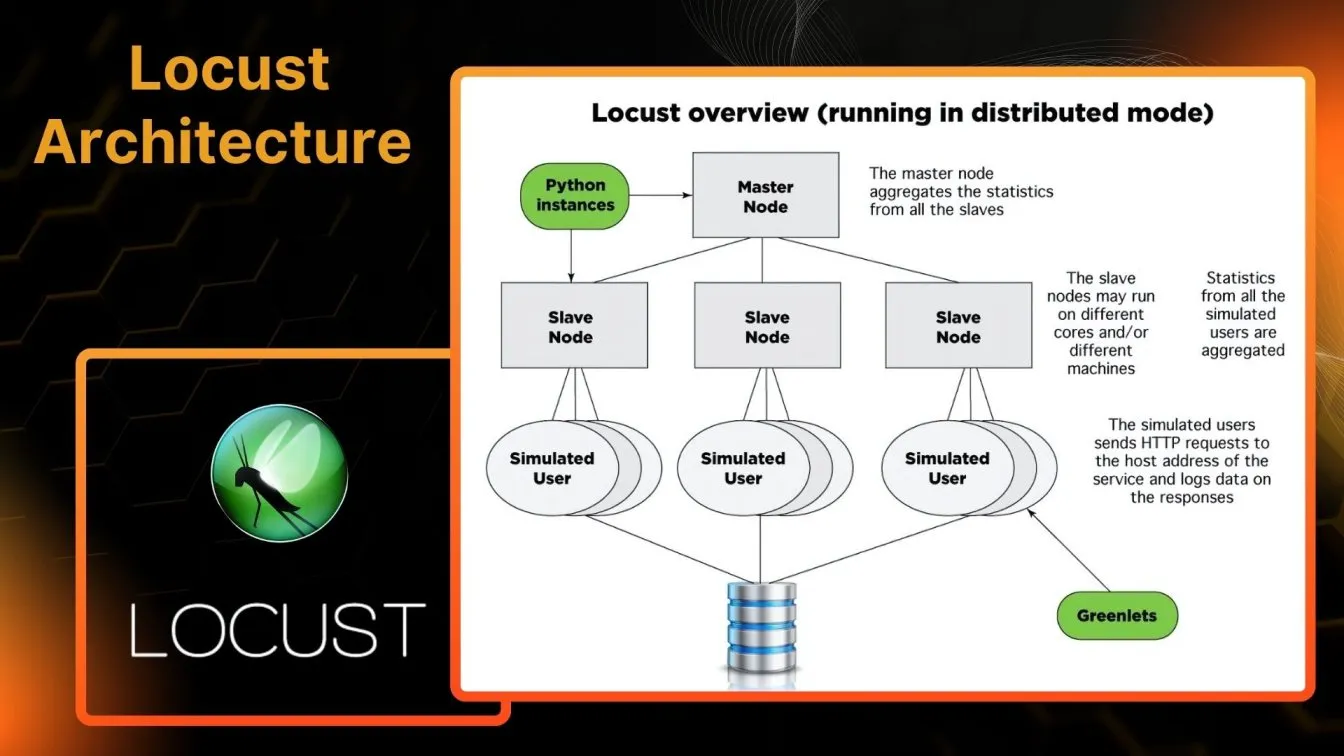
What makes Locust stand out is its ability to handle complex user scenarios with ease. Since it’s a scalable tool, it can simulate thousands of concurrent users, making it ideal for stress-testing websites, APIs, and other digital platforms. Additionally, its integration with any application framework allows teams to create custom load testing processes that fit their needs.
Key Reasons Locust Stands Out for Load Testing

- Scriptable & Flexible – Test cases are written in Python, making them highly adaptable.
- Seamless Scalability – Easily scale user load without compromising test accuracy.
- Minimal Resource Consumption – Optimized load generation for efficient testing.
- Real-Time Insights – Get immediate feedback on performance bottlenecks.
- Ideal for CI/CD Pipelines – Works well with automated software testing workflows.
With its powerful toolset, Locust simplifies site load testing, making it a go-to solution for businesses that need reliable load testing software.
Key Features of Locust for Performance Testing
Locust is a powerful tool that empowers software engineering teams to run efficient performance tests by simulating thousands of users in a virtual environment. Unlike traditional load testing tools, Locust allows for flexible scripting and real-time monitoring, making it a go-to choice for testing APIs, web applications, and other performance testing services
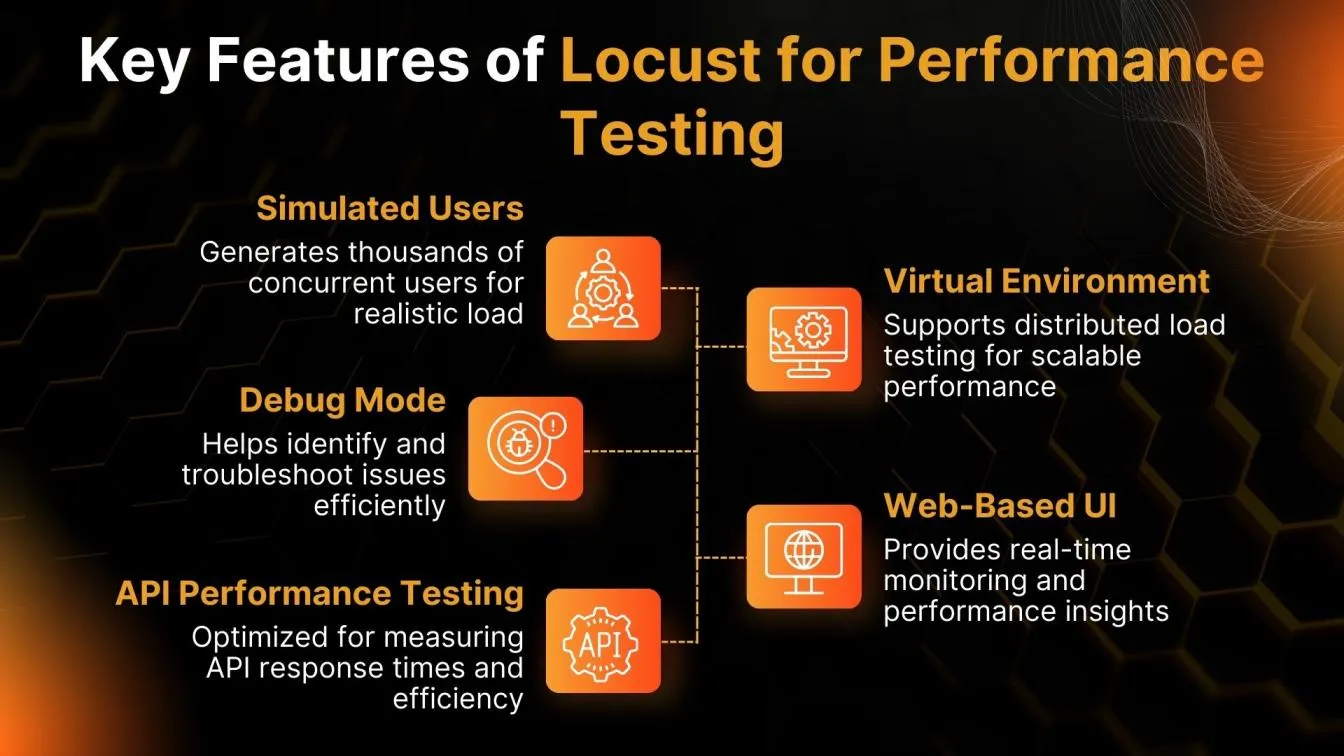
Why Locust Stands Out for Performance Testing:
- Simulated Users for Realistic Load: Locust generates thousands of concurrent users, mimicking real-world traffic patterns.
- Virtual Environment for Scalable Load Generation: Easily set up a distributed testing infrastructure to handle large-scale testing.
- Efficient Locust Tests for API Performance: Designed to handle API performance testing, ensuring applications respond optimally under heavy loads.
- Web-Based UI for Better Insights: Offers a user-friendly interface for application performance monitoring active users, response times, and failures in real-time.
- Debug Mode for Streamlined Troubleshooting: The built-in debug mode helps testers pinpoint and resolve issues quickly, improving testing efficiency.
How Locust Compares to Other Load Testing Tools
For testing application performance under different loads, the right tool can make all the difference. Some tools prioritize user friendly interfaces, while others focus on highly scalable load test monitoring. Whether you're running basic load tests or complex distributed performance testing, understanding the strengths and trade-offs of different tools is crucial.
Locust has gained popularity due to its Python-based scripting, lightweight design, and real-time reporting, making it a strong alternative to traditional tools like JMeter, Gatling, and Apache Bench. Let’s explore how Locust stands against these tools in key performance areas.
How Locust Stacks Up Against Other Tools
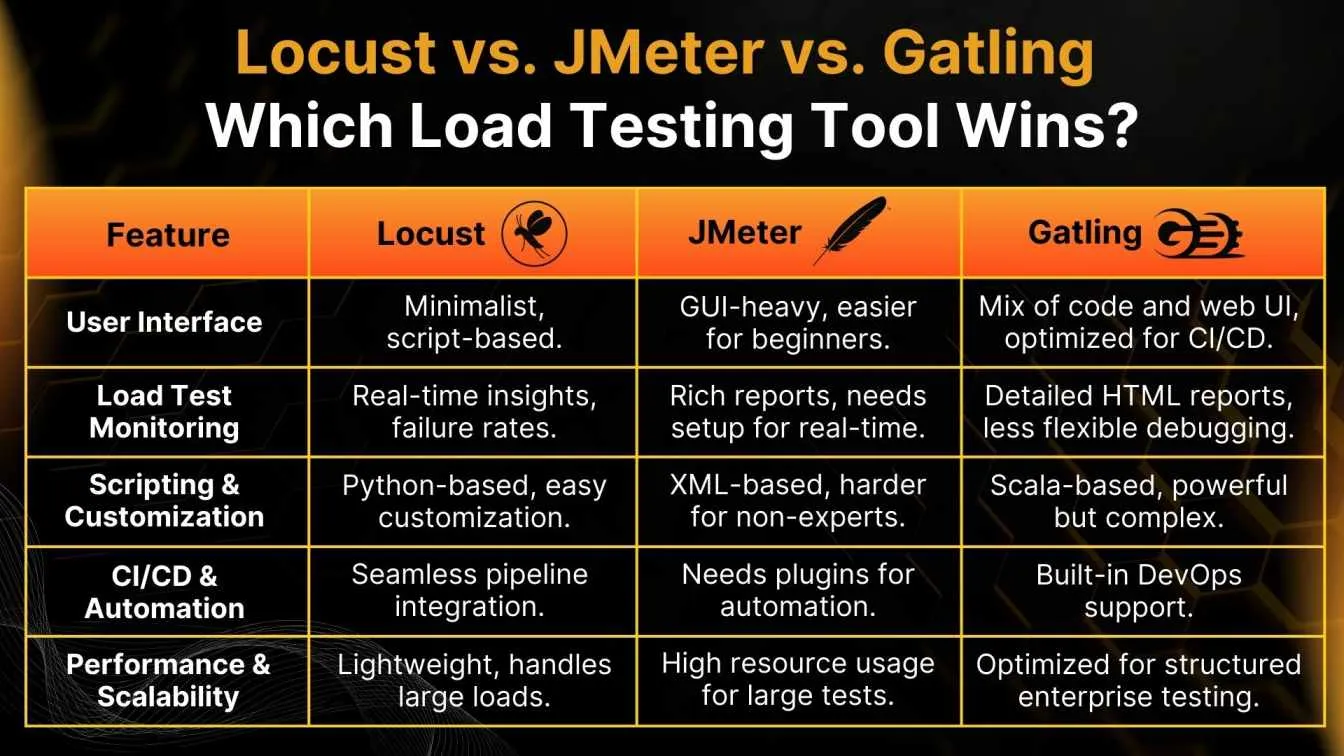
If you need a lightweight, scriptable, and scalable open-source tool with Python language support, CI/CD integration, and real-time monitoring, Locust is a great choice. JMeter load testing suits GUI-based tests, while Gatling excels in structured enterprise-level load testing. The best tool depends on your testing needs and team expertise!
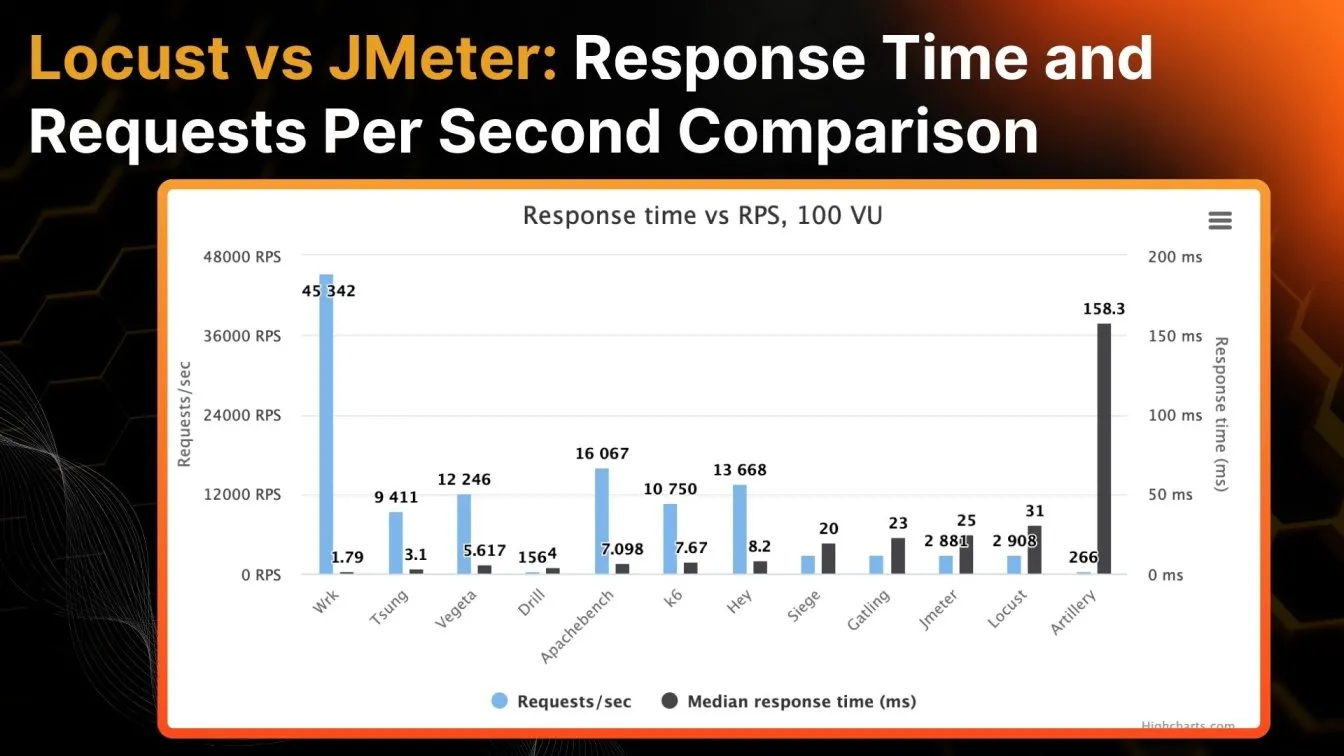
Locust vs JMeter: Which One Should You Choose?
When choosing a software performance testing tool, both Locust and JMeter offer strong capabilities for web applications. Locust is lightweight, Python-based, and ideal for custom user behavior and CI/CD integration. JMeter, with its GUI-based approach, supports a wide range of protocols and built-in elements for structured testing. If you prefer flexibility and scripting, Locust is a great fit, while JMeter suits teams needing a broader protocol range without heavy coding. The right tool depends on your testing strategy and automation needs.
How Do They Stack Up?
- Load Test Creation
- Locust: Uses a locust file (Python-based), offering flexibility for scripting complex user flows.
- JMeter: Provides a GUI-based approach, making it beginner-friendly but less customizable.
- Protocol Support
- Locust: Primarily tests HTTP-based web applications.
- JMeter: Supports multiple protocols like FTP, SOAP, JDBC, and more.
- Performance & Scalability
- Locust: Efficient in handling concurrent users, designed for distributed load generation.
- JMeter: Can simulate large loads but is more resource-intensive.
- User Interface & Reporting
- Locust: Minimal UI, with external dashboards for analysis.
- JMeter: Built-in reporting tools with detailed graphical insights.
Installing Locust: Step-by-Step Guide
Setting up Locust, an open-source load-testing tool, is quick and straightforward, making it a great choice for efficient load testing service. Whether you're testing APIs, web applications, or complex systems, the installation process ensures you have a scalable framework ready to handle thousands of concurrent users. Below is a step-by-step guide to help you set up Locust in your project directory without any hassle.

1️⃣ Install Locust Using a Package Installer
- Ensure Python (3.7 or later) is installed on your system.
- Open the command prompt or terminal and run: pip install locust
- This will install Locust and its dependencies in your environment.
2️⃣ Set Up Your Project Directory
- Create a dedicated project directory to organize your Locust test files.
- Navigate to the directory in the command prompt and initialize your load test script.
3️⃣ Configure the Locust File
- Create a locustfile.py in your project directory.
- Define user behavior and test scenarios using Python scripts.
4️⃣ Adjust Environment Variables & Firewall Rules
- If necessary, update environment variables to ensure Locust can run globally.
- Modify firewall rules to allow Locust to communicate over the required ports.
5️⃣ Run Locust for Efficient Load Testing
- Start Locust using the command: locust
- Access the web-based UI by visiting http://localhost:8089 to start testing.
With Locust installed and configured, you’re ready to simulate real-world user behavior and analyze system performance efficiently. 🚀
Writing Your First Locust Test Script
Getting started with Locust is simple, thanks to its intuitive scripting approach. By defining user behavior in a Locust file, you can simulate virtual users, control the request rate, and monitor average response times under different load conditions. Writing an effective test script allows you to analyze your application's failure rate and fine-tune its performance optimization.
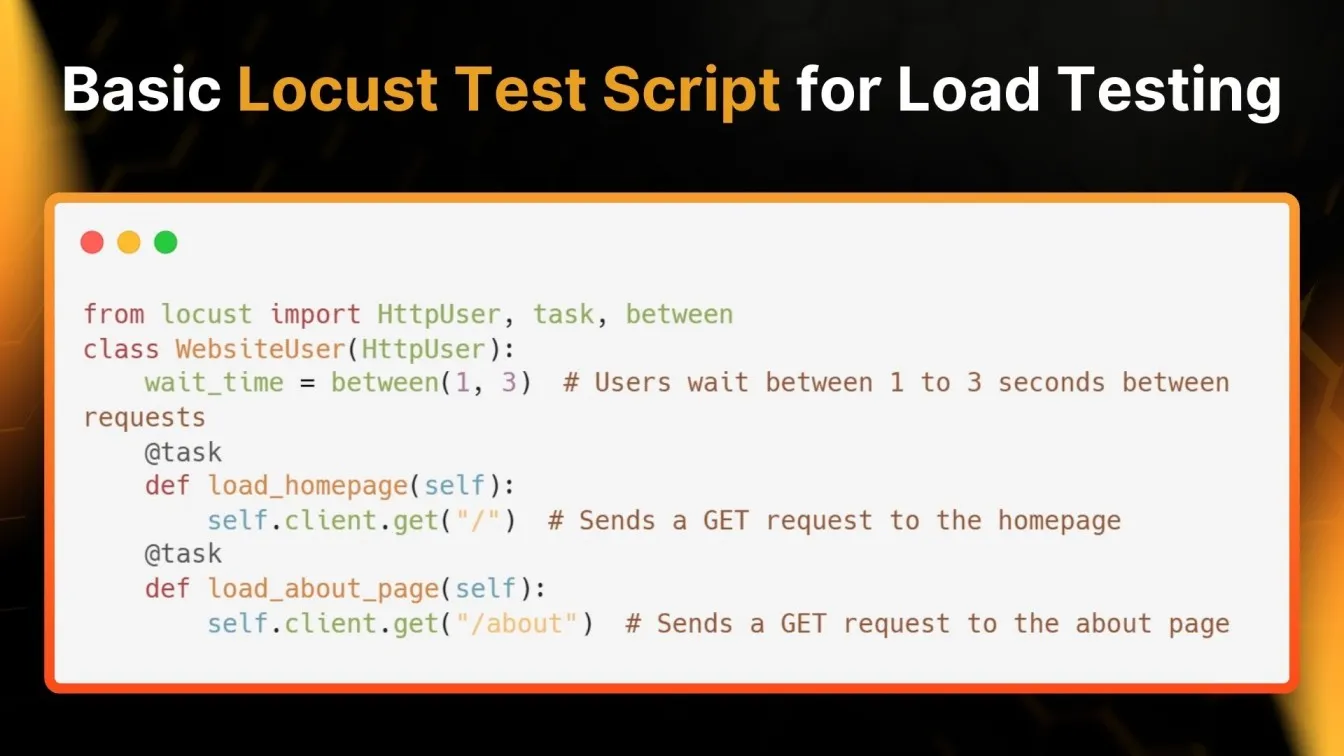
Steps to Create a Basic Locust Test Script
1️⃣ Set Up a Locust File – Create a Python script (locustfile.py) and import HttpUser and task from Locust.
2️⃣ Define User Tasks – Specify the HTTP requests your virtual users will send, such as GET and POST methods.
3️⃣ Configure Load Conditions – Set parameters like spawn rate, number of users, and expected traffic behavior.

4️⃣ Execute Tests Using Locust Command – Run locust -f locustfile.py in the command prompt to launch Locust’s web interface.
5️⃣ Analyze Application Performance Metrics – Monitor failure rate, request rate, and response times in real-time to optimize performance.
This structured approach ensures a smooth load testing process, helping you simulate real-world user interactions and identify potential performance bottlenecks effectively. 🚀
Running Load Tests and Analyzing Results in Locust
Once your Locust test script is ready, it’s time to execute load tests and analyze the results. Locust provides a simple command-line interface and a web-based UI, allowing you to monitor performance in real time. Running a test is as easy as executing a single command prompt instruction, which initiates the test and starts generating virtual users.
This below Locust dashboard provides real-time insights into requests per second, response times, failure rates, and user activity during load testing.
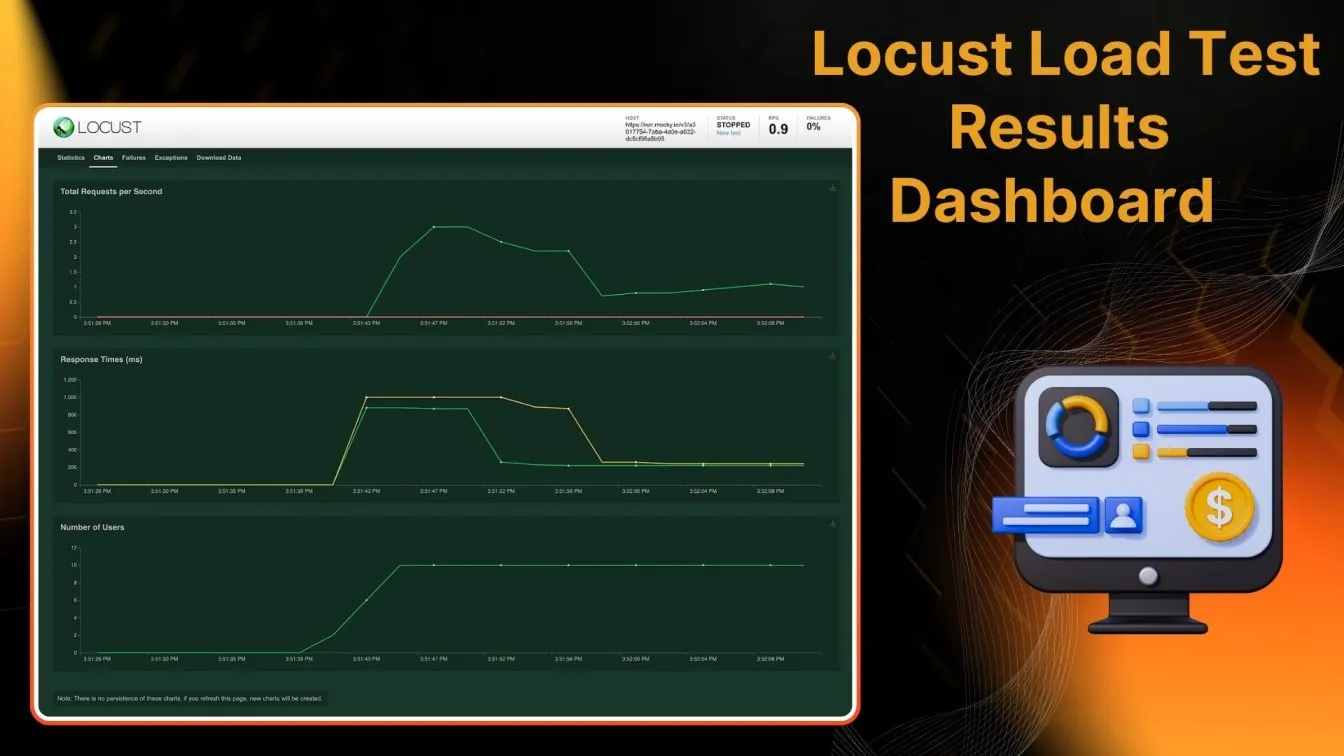
To launch a test, use the following basic command:
locust -f locustfile.py --host=https://your-app.comFor additional configuration options, check available commands using: locust --help
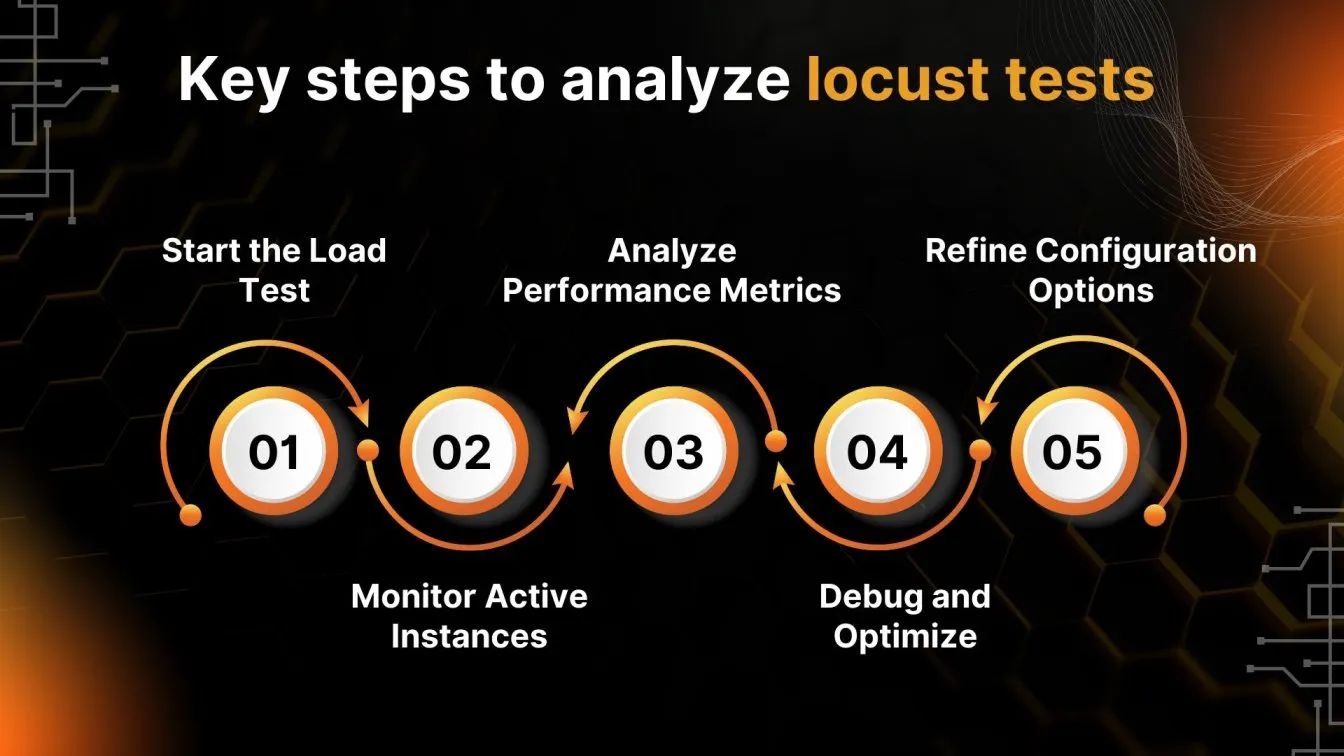
Key Steps to Running and Analyzing Locust Tests:
- Start the Load Test – Run Locust using the command prompt to begin generating virtual users.
- Monitor Active Instances – Keep track of running user instances and request rates in the Locust UI.
- Analyze Performance Metrics – Review failure counts, status codes, and response times to detect bottlenecks.
- Debug and Optimize – Adjust your application code and Locust script based on test insights.
- Refine Configuration Options – Modify settings like spawn rate and concurrent users to simulate real-world conditions.
By running these tests effectively, you can fine-tune system performance, catch potential issues early, and ensure smooth load handling. 🚀
Common Challenges When Using Locust
Locust is a powerful and flexible load testing tool, but like any performance testing framework, it comes with its own set of challenges. While it excels in handling steady traffic and bursts of traffic, certain obstacles can impact test accuracy, execution speed, and result interpretation. Understanding these challenges is essential for getting the most out of Locust and ensuring reliable test outcomes.

1️⃣ Unstable Test Results
- Running tests in inconsistent environments can produce fluctuating results, making it difficult to pinpoint actual performance issues. Ensuring a controlled and repeatable testing environment is crucial for reliable analysis.
2️⃣ High Error Rate in the Failures Tab
- A high error rate may indicate issues such as server overload, incorrect request handling, or improper test scripting. Debugging Locust scripts and monitoring server-side logs can help identify the root cause.
3️⃣ Slow Tests and Execution Delays
- Inefficient Locust scripts, network bottlenecks, or poorly optimized hardware can slow down test execution. Fine-tuning request intervals and optimizing system resources can improve efficiency.
4️⃣ Handling Complex User Behavior
- Simulating real-world user behavior, such as login sessions, token authentication, and multi-step workflows, requires advanced scripting. Writing modular and reusable test scripts helps in managing complex scenarios.
5️⃣ Challenges in Application Load Management
- Balancing steady traffic with sudden bursts of traffic is tricky, and improper configurations can lead to under or overloading of servers. Carefully defining the ramp-up rate and concurrent users ensures realistic test conditions.
By addressing these challenges proactively, you can fine-tune Locust to deliver more accurate and actionable load testing insights. 🚀
Integrating Locust with CI/CD Pipelines for Continuous Testing
Integrating Locust into CI/CD pipelines ensures continuous performance validation and prevents performance issues before deployment. By automating load testing within the CI/CD workflow, teams can detect bottlenecks early and optimize application performance management efficiently.
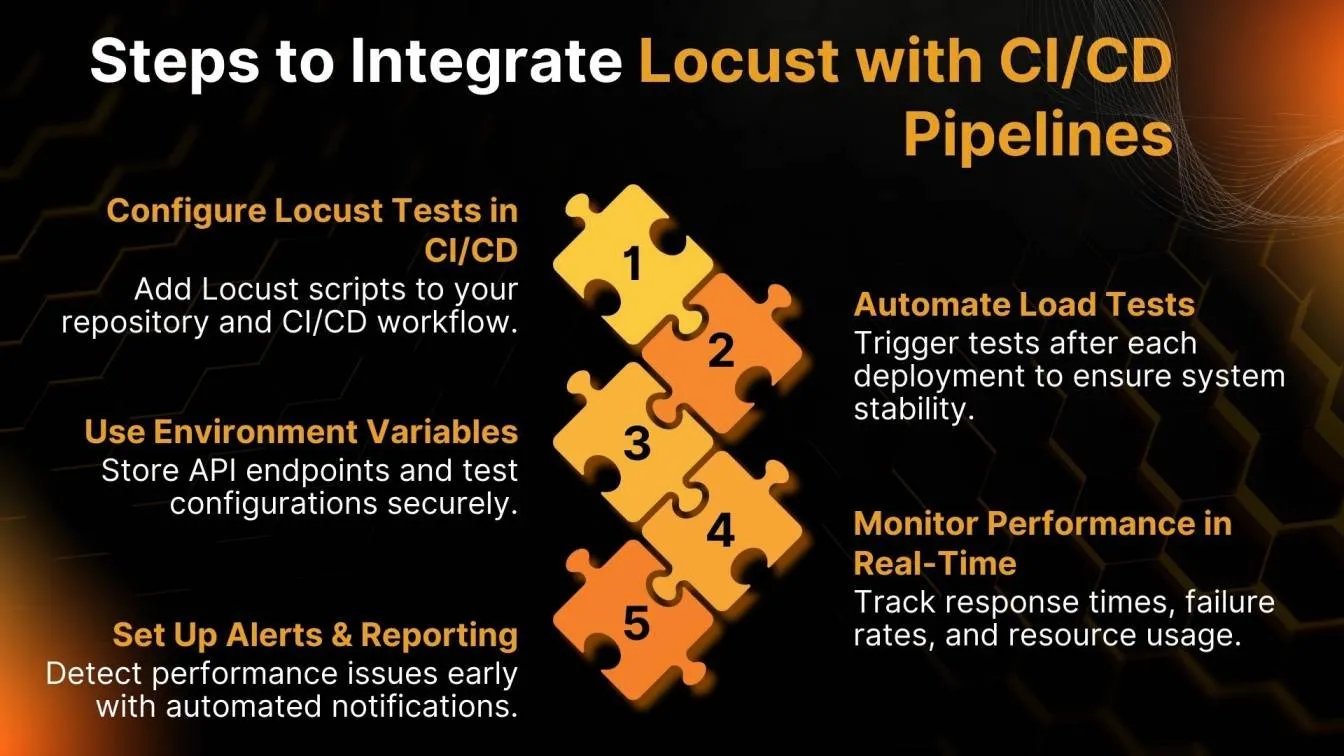
To achieve this, configure Locust tests as part of your build process using tools like Jenkins, GitHub Actions, or GitLab CI/CD. You can trigger Locust tests automatically after each deployment, validating API performance and system stability under different load conditions.For seamless integration, store your Locust test scripts in the project repository, use environment variables for configuration, and set up alerts for performance failures. Additionally, use custom dashboards to track response times, failure rates, and resource consumption in real-time.
Frugal Testing offers comprehensive QA testing services for enterprises, ensuring scalable, high-performance applications with robust automation, real-time monitoring, and CI/CD integration.
By embedding Locust within the CI/CD pipeline, teams can maintain application stability, enhance scalability, and improve overall user experience, ensuring every release meets performance benchmarks before reaching production. 🚀
Future of Locust: What’s Next for Load Testing?
As software performance demands increase, Locust continues to evolve as a preferred open-source load testing tool. With the growing need for scalability, real-time monitoring, and AI-driven automation, Locust is expected to integrate more advanced features for better performance insights.
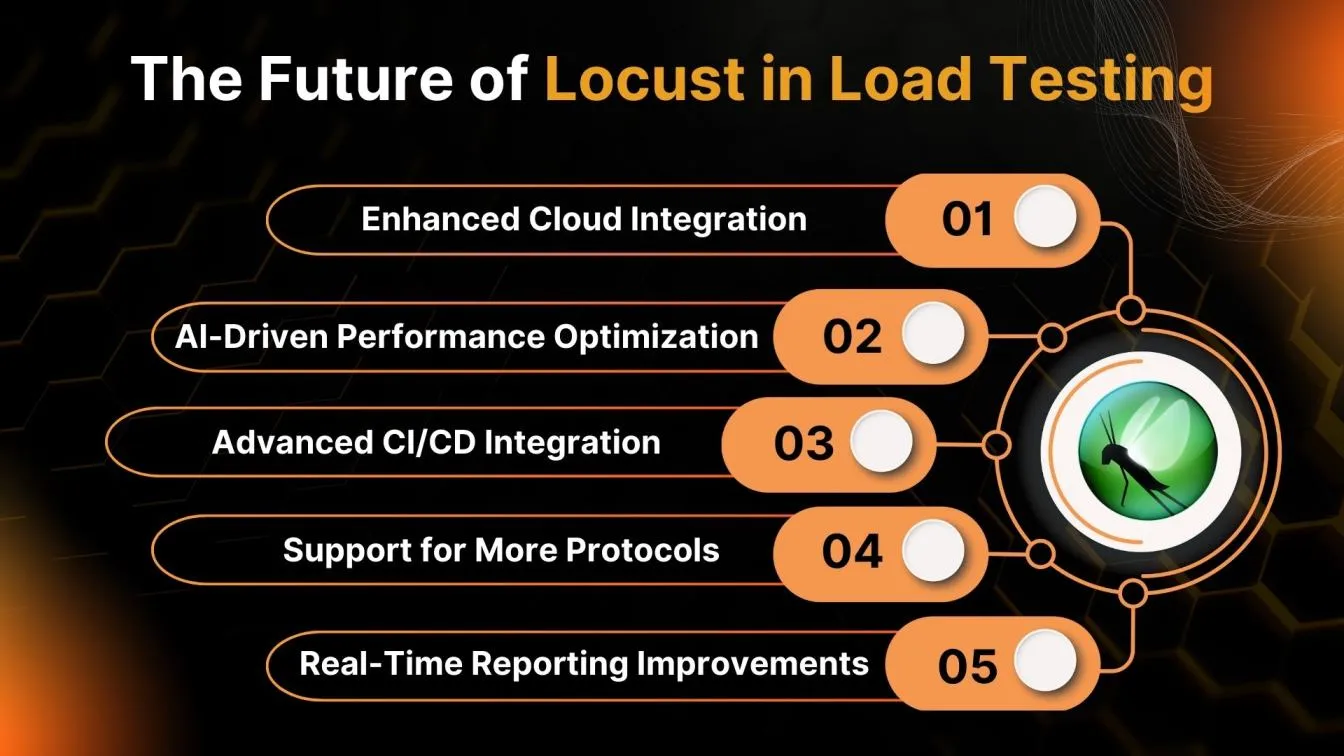
Key trends shaping the future of Locust include:
✅ Enhanced Cloud Integration – More support for cloud-based load testing to simulate global traffic conditions.
✅ AI-Driven Performance Optimization – Predictive analytics to detect bottlenecks and optimize test scenarios.
✅ Expanded CI/CD Capabilities – Seamless integration with DevOps pipelines for automated performance validation.
✅ Support for More Protocols – Broader testing beyond HTTP requests to cover WebSockets, gRPC, and more.
✅ Improved Real-Time Reporting – More advanced dashboards for tracking live test results and system behavior.
With its Python-based flexibility and developer-friendly approach, Locust is set to remain a go-to choice for large-scale performance testing in modern software environments. 🚀
Frugal Testing actively shares insights, updates, and job opportunities on LinkedIn. Connect with us to stay informed about our latest developments by visiting our Frugal Testing LinkedIn page.
Conclusion
Locust is a lightweight, scalable, and scriptable load testing tool that enables teams to simulate thousands of virtual users, analyze real-time performance, and optimize applications under load. Its Python-based flexibility, seamless CI/CD integration, and web-based UI make it a preferred choice over traditional GUI-heavy tools like JMeter.

In this guide, we covered installation, writing test scripts, executing tests, and analyzing results. We also explored Locust vs. JMeter, best practices for large-scale testing, and integrating Locust into CI/CD pipelines for automated performance testing.
As load testing evolves, Locust continues to expand with cloud integration, AI-driven optimizations, and real-time reporting. By leveraging its custom test scenarios and real-time monitoring, teams can ensure high-performing, scalable applications that deliver seamless user experiences under heavy traffic loads. If you're looking for bug testing services with reliable automation and performance testing solutions, Frugal Testing is here to help. 🚀
People also asked
What is the difference between Gatling and Locust?
Gatling uses Scala and is optimized for high-performance simulations, while Locust is Python-based, offering flexibility and easier scripting for load tests.
How long does load testing take?
Load testing duration varies based on test complexity but typically runs from a few minutes to several hours to analyze performance under different traffic conditions.
How often should you run a load test?
Load testing should be performed regularly, especially before major releases, after infrastructure changes, or when user traffic significantly increases.
Which tool from HP is a widely used load testing tool?
HP LoadRunner is a widely used enterprise-grade load testing tool designed for high-scale performance testing.
Is JMeter still relevant?
Yes, Apache JMeter remains relevant as a popular open-source load testing tool, widely used for web applications, APIs, and performance benchmarking.

%201.webp)