Delivering high-performance apps is a critical aspect of any software🚀. For a web, mobile, or backend system, ensuring smooth performance under load is crucial for a seamless user experience.
That's where performance testing with tools like Apache JMeter comes into play, helping you spot performance degradations, analyze average response times, and ensure scalability.
But why stop there? 🤔 To keep up with agile development environments, adopting a proactive approach is key. Automate tests and integrate them into your CI/CD pipelines seamlessly.
By pairing JMeter with CI/CD, you can automate regular performance checks, monitor the execution process, and ensure every release is smooth and reliable.
In this blog, we’ll explore how to set up JMeter with CI/CD for automated testing, from simple load tests to advanced setups using configuration files, tools like Jenkins, GitHub Actions, and Bitbucket, enabling in-depth analysis and utilizing JMeter's rich features to handle concurrent users effectively. 💡
This blog will help you learn about:
- What JMeter is and how it helps with performance testing for web apps and APIs.
- The core principles of CI/CD pipelines and how they automate the software delivery process.
- Why integrating JMeter with CI/CD ensures continuous performance testing and faster releases.
- Step-by-step setup to perform the basic setup of JMeter in your CI/CD pipeline for automated testing.
- How to automate JMeter tests for efficient and real-time performance evaluation.
Getting Started with JMeter
Before diving into software performance testing, it’s essential to understand the transformative approach offered by the tool that powers this process - JMeter. For someone new to performance testing or looking to enhance their skills, JMeter provides an efficient and flexible solution for evaluating load-testing scenarios in web applications, APIs, and beyond.
With its focus on enabling teams to dive into performance metrics and offering rich data analysis, JMeter is a cornerstone in the application of engineering principles for performance testing.
In this section, we'll explore what JMeter is and why it’s one of the most widely used tools in development pipelines for achieving the primary objectives of performance testing under various load conditions.
What is JMeter?
Apache JMeter is an open-source tool primarily used for performance testing and load-testing applications. It allows you to simulate heavy loads on servers, networks, or objects to test their strength and analyze overall performance.
Originally designed for testing web applications, JMeter has evolved into a powerful tool that supports testing for databases, REST APIs, and other performance testing services.
JMeter simulates real-world load conditions and generates detailed performance metrics 📈, offering insights into crucial aspects of performance engineering, making it indispensable for modern load-testing scenarios 🚀.
.webp)
JMeter helps you identify performance bottlenecks and evaluate how your application behaves under stress. For testing a web server's response times ⏱️ or the scalability of API tests 📊, JMeter makes it easy to gather essential data and improve your application's performance.
.webp)
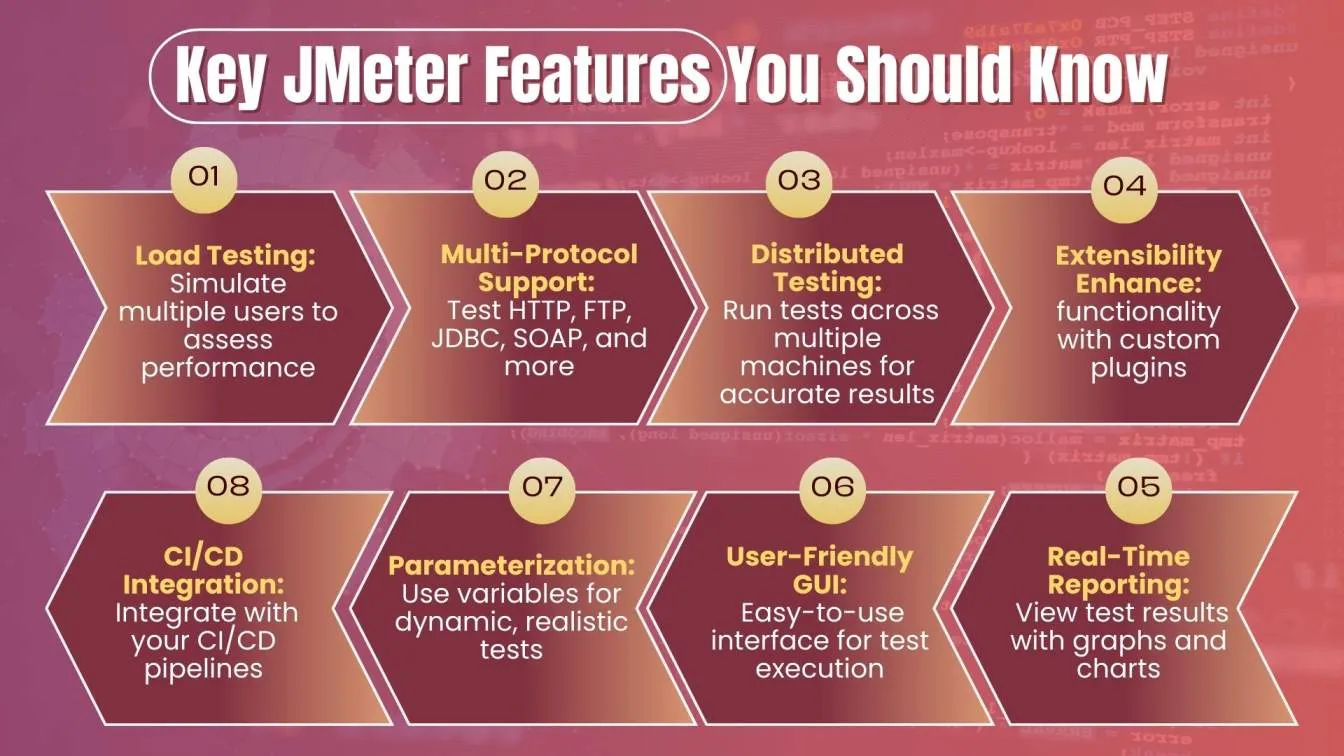
Key Features of JMeter
JMeter offers a wide range of powerful features that make it ideal for performance testing techniques across various applications and services. With its user-friendly interface and ability to handle complex test scenarios, JMeter allows testers to simulate traffic, generate detailed reports, and integrate seamlessly into your CI/CD pipelines.
It is designed to handle real-world scenarios, ensuring accurate and reliable performance insights. Let’s dive into the standout features that set JMeter apart!
Understanding CI/CD Pipelines
CI/CD (Continuous Integration/Continuous Delivery) pipelines are essential in modern software development. They automate the CI/CD process, integrating new code changes and delivering them to production quickly and efficiently. By utilizing CI/CD software, developers ensure their code is always in a deployable state, improving collaboration 🤝 and reducing the time it takes to release new features or fixes 🚀.
What are CI/CD Pipelines?
CI/CD pipelines are a set of automated processes that enable continuous integration and continuous delivery of software. Continuous Integration (CI) focuses on automating the process of integrating new code changes into the main codebase regularly, ensuring that developers can detect errors early. Continuous Delivery (CD) takes it further by automating the deployment of the integrated code into production-like environments.
.webp)
Here are some of the most popular CI/CD tools used in the industry today. These tools help automate key stages of software development process, including code integration, testing, and deployment, making the release cycle more efficient and reliable.
.webp)
Key Stages in a CI/CD Pipeline
The key stages in a CI/CD pipeline can vary depending on the project and tools used, but here are the most common ones:
.webp)
- Code Commit: Developers commit their code changes to the version control system (e.g., Git), which triggers the CI/CD pipeline.
- Build: The code is compiled, dependencies are installed, and artifacts are created (such as a binary or Docker image).
- Test: Automated tests, including unit tests, integration tests, functional tests and performance tests, are run to ensure the code works as expected.
- Deploy: The code is deployed to a staging environment or directly to production if it passes all the tests, reducing the risk of issues in production.
- Release: The code is released into production and made available to end users.
- Monitor: After deployment, monitoring tools are used to track the internal application's performance and identify any issues.
Why Integrate JMeter with CI/CD?
Performance testing automation 🤖 is essential for ensuring software performs well under real-world traffic. Using software testing tools like JMeter, teams can simulate real-world traffic scenarios and run testing types to detect bottlenecks.
Performance test scripts 📜 ensure consistent testing and conditions, speeding up the process and utilizing software development skills to address issues before production. Integrating JMeter with CI/CD pipeline in performance testing streamlines performance testing and ensures higher software quality. Here's why it's essential:
.webp)
- Continuous Performance Testing 🔄: Automatically run performance tests with each code change to detect issues early. This ensures faster identification of potential bottlenecks.
- Automated Testing 🤖: Save time and reduce human errors by automating performance tests during the build process. It streamlines the testing process and increases accuracy.
- Quick Feedback ⚡: Receive instant feedback on performance issues, allowing for quicker fixes and faster releases. This speeds up the development lifecycle.
- Seamless Integration 🔗: Easily integrate JMeter with CI CD popular tools like Jenkins, GitLab, or Travis CI. It ensures smooth integration with existing workflows.
- Consistent Results 📊: Ensure consistent testing conditions across all builds, reducing variability in test results. This leads to more reliable performance data.
- Improved Collaboration 🤝: Enhance collaboration between developers, testers, and operations teams with automatic real-time insights. This leads to better cross-team communication and more efficient decision-making.
- Reduced Manual Work 🛠️: Minimize manual intervention, making testing faster and more efficient. This frees up time for more critical tasks in the development cycle.
Integrating JMeter with CI/CD Pipelines
Integrating JMeter into CI/CD pipelines enables continuous testing, ensuring early detection of performance issues and improving software quality with real-time feedback. The process involves automating the execution of tests in JMeter, analyzing test results, and ensuring seamless integration with CI/CD tools like Jenkins, GitLab, Travis CI, and others.
This integration accelerates the release cycle, reduces the need for manual testing, and enhances collaboration between development teams, testers, and operations teams.
Setting Up JMeter for CI/CD Pipelines
To effectively integrate JMeter into your CI/CD pipeline, proper setup is essential. Here's a step-by-step guide to get started with the initial setup:
1. Install JMeter 🛠️
Begin by installing Apache JMeter on the machine where the tests will be executed. JMeter should be installed in a non-GUI mode for optimal performance in CI/CD testing environments.
- Apache JMeter Download: Get the latest version of JMeter from the official Apache JMeter website.
.webp)
- Installation: Extract the downloaded archive to a folder on your machine. No complex installation steps are needed-JMeter is ready to use right out of the box!
2. Configuring JMeter for CI/CD 🔄:
To run JMeter in a CI/CD pipeline, configure it to execute in non-GUI mode for efficiency. Non-GUI mode reduces system resource usage, making it ideal for automated test execution.
.webp)
3. Integrating JMeter with CI/CD Tools 🔧:
To integrate JMeter with your CI/CD pipeline, automate the execution of performance tests during the build process. Here's how:
- Choose a CI/CD Tool: Use tools like Jenkins, GitLab CI, or CircleCI to trigger JMeter tests automatically on code commits or scheduled builds.
- Configure Triggers: Set up triggers to run tests:
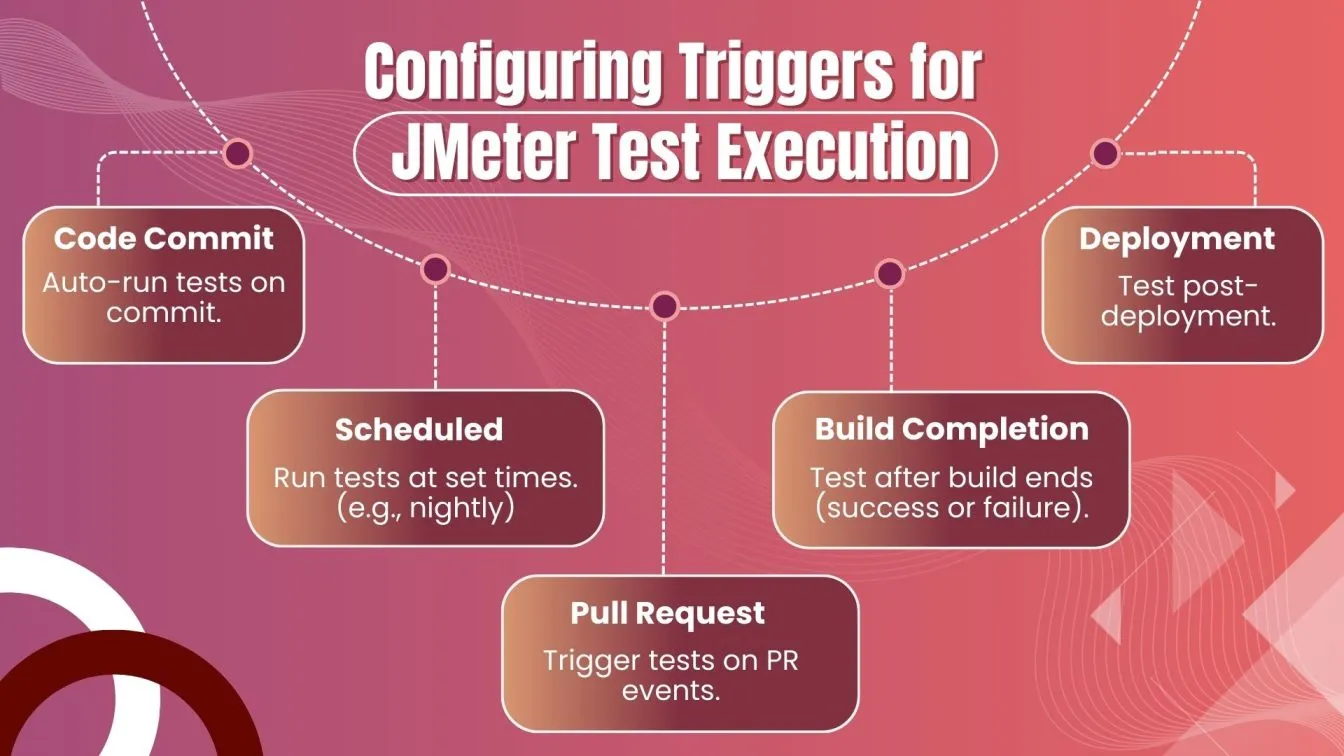
- Run JMeter in Non-GUI Mode: Ensure JMeter runs in non-GUI mode (-n) to optimize resource usage in the CI/CD environment.
- Automate Results: Use the JMeter Plugin Manager to install plugins (e.g., JMeter Plugin for Jenkins) and visualize test results directly within your CI tool, providing real-time performance feedback.
4. Setting Up Test Plans 📋:
- Store in Version Control: Keep your JMeter test plans in systems like Git for easy access and version tracking.
- Modular and Reusable: Design test plans to be modular, so they can be reused across different builds and environments.
- CI/CD Integration: Ensure your CI/CD automation processes automatically fetch the latest test plans during each build, keeping your testing aligned with the most up-to-date testing requirements and reducing manual intervention.
- Parameterization: Use parameters in test plans to handle different environments and detailed configurations.
Integrating JMeter with Jenkins
Integrating JMeter with Jenkins allows for seamless integration of continuous performance testing into your CI/CD platforms. By setting up this integration, you can automate performance tests with each code commit and get real-time feedback on your application's performance.
1. Set Up Jenkins for JMeter Integration ⚙️
- Install Jenkins: Download and install Jenkins from the official Jenkins website if you haven't already. Ensure it's running properly.
.webp)
- Install JMeter Plugin for Jenkins: Install the JMeter plugin in Jenkins for easy execution and result visualization of JMeter tests.
.webp)
2. Creating Jenkins Jobs 🧑💻:
- Job Setup: Create a new Jenkins job (e.g., Freestyle project or Pipeline) to run your JMeter simple tests automatically.
- Go to New Item in Jenkins and select Freestyle project or Pipeline based on your needs.
- Configure the source code repository (e.g., Git) for fetching your test plan.
3. Configure Jenkins Build Steps 🛠️:
- In the Jenkins build configuration, add a build step to execute JMeter tests in non-GUI mode.
- Select Execute Shell (or Execute Windows Batch Command if you're on Windows).
- Reference the JMeter command-line executions configuration previously set up in Configuring JMeter for CI/CD. Ensure the correct paths to your test plan and result files are specified for smooth execution.
4. Trigger Tests Automatically 🔄:
- Automatic Triggers: Configure Jenkins to trigger JMeter tests automatically when certain conditions are met:
.webp)
Automating JMeter Test Execution
Automating JMeter test execution streamlines automatic performance testing within your CI/CD pipeline, ensuring tests run consistently with each code change.
1. Automating with Jenkins Pipelines 🔄
- Leverage Jenkins Pipelines to seamlessly automate JMeter test execution within your CI/CD workflow.
- Define the steps for test execution directly in the Jenkins pipeline script using the sh or bat commands, referencing JMeter configurations already in place.
- This ensures your performance tests run as an integral part of the build, deploy, and test cycle.
2. Scheduling Tests ⏰
- Schedule JMeter tests to execute automatically at predefined intervals, such as nightly builds or weekly runs.
- For real-time continuous monitoring, configure triggers to run tests after each code commit or pull request.
- These schedules ensure proactive detection of performance regressions before they affect production.
3. Run Tests Across Environments 🌎
- Automate the execution of JMeter test plans across various environments - development, staging, and production.
- Use environment-specific configurations and parameterization in test plans to ensure accurate and adaptable performance validation.
- This helps identify environment-specific performance bottlenecks early.
4. Parallel Test Execution ⚡
- Scale your performance testing by configuring distributed JMeter load-testing tools across multiple servers or containers.
- Running load tests in parallel enables you to simulate higher user loads and test the scalability of your application under stress tests.
- Tools like Kubernetes or Docker can facilitate distributed execution in containerized environments.
Analyzing JMeter Results in CI/CD
Once JMeter tests are integrated into your CI/CD pipeline, analyzing the results is crucial for ensuring that your application performs well under load and that issues are identified early in the development process. Here's how to analyze JMeter test results in a CI/CD environment:
1. View Test Results in Jenkins 📊
- JMeter Plugin: Visualize key metrics like response time, throughput, and the examination of error rates directly in Jenkins using the JMeter plugin.
- Published Results: Configure Jenkins to generate results in HTML or JTL formats for easy access.
.webp)
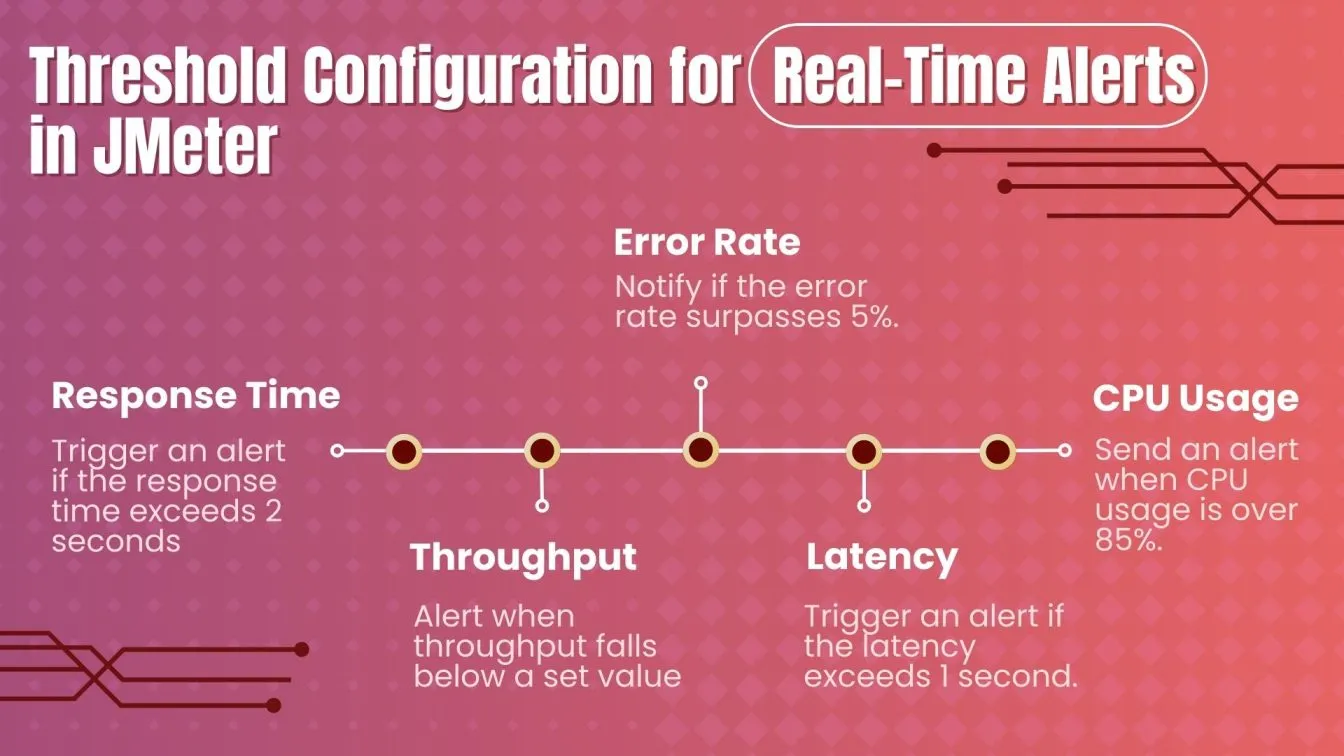
2. Set Up Real-Time Alerts 🛑
- Automated Alerts: Notify the team of performance issues like high response times or error spikes.
- Threshold Configuration: Configure performance thresholds for various metrics, such as:
3. Generate Detailed Test Reports 📋
- JMeter Reports: Generate HTML/PDF reports with charts for key metrics like response time, throughput, and error rates.
- Historical Analysis: Review past reports to track trends and spot performance changes.
4. Compare Results Across Builds 🔄
- Track Performance Trends: Monitor key metrics across Jenkins builds to spot regressions or improvements.
- Use Graphs and Charts: Leverage visual tools for quick comparisons of performance metrics.
5. Identify Bottlenecks and Issues 🧐
- Root Cause Analysis: Pinpoint performance bottlenecks like slow queries or high resource usage.
- Actionable Insights: Optimize code, refactor, or scale infrastructure based on findings.
Conclusion
Integrating Apache JMeter into your CI/CD pipeline empowers your team to deliver high-performance software with ease and confidence. By the automation phase of performance testing, configuring seamless integrations with tools like Jenkins, and enabling scalability testing, you ensure faster feedback, proactive performance monitoring, and efficient resource utilization.
These practices not only streamline your testing workflow but also lay the foundation for continuous improvement, ensuring your application performs flawlessly under any load. Use JMeter for flexible test automation to ensure your software works smoothly and performs at its best! 🚀
People also asked
👉 Can we integrate JMeter with Selenium?
Yes, JMeter can be integrated with Selenium using the WebDriver Sampler for performance testing of web applications while Selenium handles functional testing.
👉 How to automate API testing using JMeter?
Automate API load testing by using JMeter’s HTTP Request Sampler to define endpoints and configure assertions, running tests as part of your CI/CD pipeline.
👉 What is a CI/CD pipeline example?
An example of a CI/CD pipeline is Jenkins automating a Java app by pulling code from Git, running JUnit tests, and deploying it to a Tomcat server.
👉 How to run multiple JMeter scripts in Jenkins?
Run multiple JMeter scripts in Jenkins by creating separate build steps or using Jenkins Pipelines for parallel execution across different machines.
👉 What are the limitations of JMeter?
JMeter may consume a lot of memory, is not ideal for browser-based testing, and can be complex for advanced scripting, especially in large-scale tests.



%201.webp)

