It is really hard to decide which tool to use Apache JMeter or Gatling Tool. Both of them are Load testing tools. Whenever we consider which tool to use, there are so many questions that come to mind.
- Which tool has the best performance? Best documentation? Easy to install?
- Which tool should I use or I can use a combination of the tools?
There is a never-ending list of questions that come to our mind. In this blog post, we try to cater a few questions and will try to help you to decide which tool is appropriate for which project environment.
1. Project History:
This section sheds some light on the historical information about 2 tools.
JMeter History:
JMeter was first released 21 years ago in 1998. This is a pure Java project with more than 20 versions released till now. JMeter is an open-source project released under Apache 2.0 License. Till now, 33 people contributed to the project. So, in a way, we can say that Apache JMeter is a mature project.
Gatling Tool:
If we talk about the Gatling tool, it was first released in 2011, so it is just 8 years old. This is a comparatively new tool compared to JMeter. Gatling is a Scala-based load testing tool that supports full Functional Programming. It is also an open-source tool registered under the Apache 2.0 License. More than 60 people contributed to this project to date.
Both JMeter and Gatling are maintained regularly. But we can say, JMeter is a clear winner. JMeter has a codebase of 500k lines of code, which is far more than Gatling with 50k lines of code. This is probably due to the use of Scala in the Gatling tool, which is a concise language if we compare it with Java. Moreover, JMeter is a more mature project with more number of contributors as compared to the Gatling tool.
2. Documentation:
The match between JMeter and Gatling becomes more clear with discussion on documentation.
JMeter's Documentation:
JMeter's documentation is very detailed, where each feature of the tool is detailed with every possible setting.
Gatling Documentation:
Gatling Documentation is very concise and clear document.
Both the tools covers:
a. Installation guide
b. Quick Start guide
c. Tutorials
d. Reference Guide
Both the tools have a community on StackOverflow. Verdict for this comparison is that both tools are equally good.
3. Development:
This section will give an overview on which programming language is used for developing the 2 tools.
JMeter Development:
Apache JMeter is developed using Java Programming Language. This is an open-source tool. However, OpenHub shows that it also contains HTML and XML.
Gatling Development:
Gatling is a load testing tool developed using the Scala programming language. Since Scala supports Functional Programming aspects, it automatically makes Gatling having functional programming aspects.
Here we can say Gatling is a winner as it is open-source plus the development language is Scala, which is concise and adds Functional Programming aspects to the feature list of Gatling.
4. Built-in Facilities:
In this comparison, we will see out of the 2 tools which are easy and light to execute.
JMeter:
JMeter supports execution in 3 different modes:
- GUI Mode
- Server Mode
- Command Line Mode
Gatling:
Gatling, on the other hand, supports only 1 mode.
- Command Line Mode.
It does not support UI Result Listeners, without which it is very difficult to analyze the results. As a graphical view of results helps in better analysis.
As you can see, JMeter is the winner in this area, as it offers the developers with the choice to either go with GUI mode, Server mode or command line mode. Whereas in Gatling developer have only 1 choice command line mode.
5. Setup:
Both the tool has prerequisites Java JRE pre-installed on the machine.
JMeter Setup:
- Download JMeter Archive
- Unzip the archive
- Execute ./bin/jmeter.bat (Executable Batch File)
Gatling Setup:
- Download Gatling Archive
- Unzip the archive
- Execute ./bin/gatling.bat (Executable Batch file)
6. Flexibility:
We will see the list of features of the 2 tools. Which protocols they support.
JMeter's Features:
JMeter supports a variety of protocols:
- HTTP, HTTPS
- SOAP/ REST Web Services
- FTP
- JDBC
- LDAP
- SMTP(S), POP3(S), IMAP(S)
- TCP
- GUI Scripting
Gatling Features:
Now we will see the list of protocols that Gatling support:
- HTTP, HTTPS
- JMS Load testing
- REST APIs
- HTML Reporting
So, you can clearly see JMeter has more set of features, thus more flexibility in load testing than Gatling. JMeter is a winner in this comparison.
7. Scripting:
One of the biggest differences among both the tools is the way they save the file.
JMeter:
Jmeter saves the project as an XML file with jmx extension. JMX is more verbose than the Gatling Scala Simulation. JMeter has GUI to open and display the jmx file. Do not attempt to modify the JMX file yourself, as these files are not sustainable.
Gatling:
In Gatling, projects are saved as simulations. Gatling simulations can be edited and modified directly. Gatling has no GUI, this means you have to write the code to modify the simulations. Scala IDE can be used to modify Gatling Simulations.
JMeter is user-friendly due to the GUI part but you can not edit the JMX file. On the other hand, Gatling has no GUI, thus you have to write code to do the modification, but it is still possible to modify simulations. It is entirely your choice to decide which tool to use if we decide on the basis of Scripting.
8. Performances:
We will discuss the paradigms used by 2 tools that affect the performance of the tools.
JMeter:
JMeter uses One Thread= One User Paradigm. It means the simulated user is equal to one thread where Thread.sleep() is used to simulate Wait time.
Gatling:
Gatling, on the other hand, uses much more advanced technology, Akka. Akka allows for full asynchronous computing. It is a distributed framework based on the Actor Model which can simulate multiple virtual users with a Single Thread.
Here, Gatling is surely ahead of JMeter, but one of the major limitations is Network Bandwidth bottleneck, where simulating multiple virtual users on a single machine reduces the network bandwidth.
Choosing among JMeter or Gatling is completely your choice. You simply need to list your project requirements, which will help you to make a more wise decision.
We have tried to help you to get an insight into each tool feature that will help you to at least decide which tool is more appropriate as per your requirements.
9. Test Execution:
JMeter Test Execution:
JMeter can be executed in 3 different modes:
a. GUI Mode
b. Server Mode
c. Command-line Mode
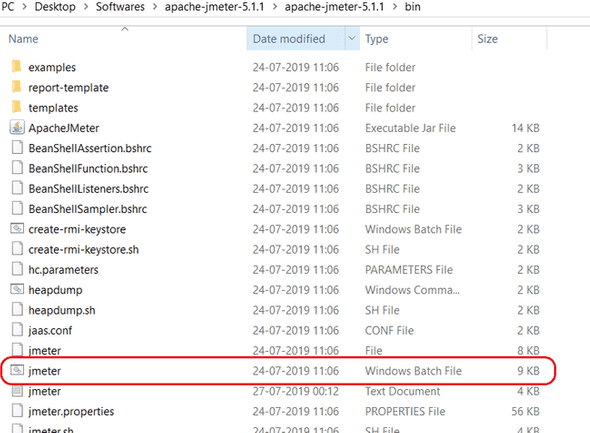
a. GUI Mode: If you are using Windows, navigate to the bin folder in the installed directory. You will find a Windows Batch File under the name jmeter.bat

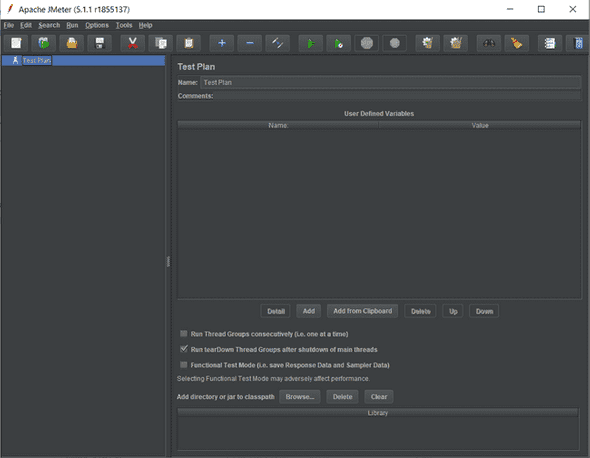
Just execute this Batch File and You will see the Apache JMeter Windows.


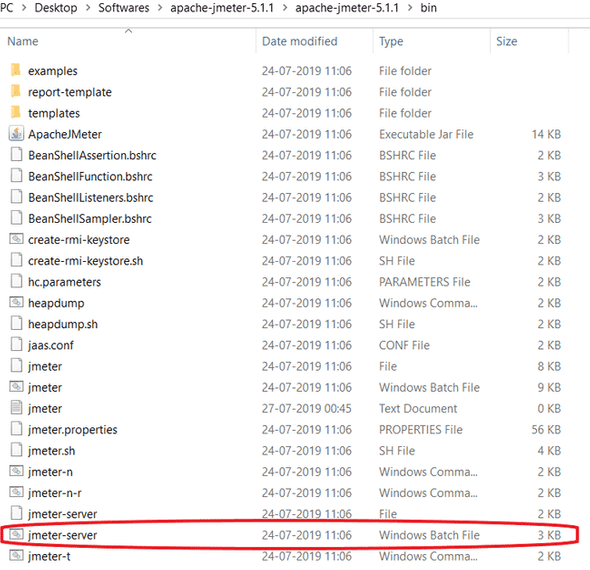
b. Server Mode : Server Mode is designed for Distributed Testing Environment like a Client-Server Model, where Apache JMeter will run in Server Mode on Server Computer and in GUI Mode on Client Computer.
To start JMeter in Server Mode, just execute the Windows Batch File jmeter-server.bat in the bin directory.

c. Command Line Mode: Running JMeter in GUI Mode consumes a lot of computer memory. This is why it is not advisable to run JMeter in GUI Mode for Load Testing. For saving resources, you may choose to execute JMeter in Command Line Mode.
- Open the command prompt.
- Navigate to the bin folder in the Apache JMeter directory.
- Execute the following command.
jmeter -n -t SampleTest.jmx -l testlog.jtl

-n: Specifies JMeter to run in Non-GUI Mode.
-t: Specifies the name of JMX File containing the test plan.
-l: Specifies the name of the JTL file to log test results.
Other than these options, there are so many parameters available. You can find
the list of the parameters from Apache JMeter - User's Manual.
JMeter offers the user an option to save the JTL file while executing the test in Command-line mode and view the graphical view of results using the saved JTL file.
There are a variety of listener interfaces available in GUI Mode.
Gatling Tool Test Execution:
Gatling can be executed in 1 mode:
Command Line Mode: Executing Gatling tool in command-line mode requires you to follow these steps:
- Open the command prompt.
- Navigate to the folder where the gatling.bat file is located. In most cases, it is in bin folder.
- Execute gatling.bat file.
- After few seconds, you will be able to see the list of simulations. Select the one that you want to execute.
- Select the desired simulation number and press Enter.
- After selecting the simulation number, you will be asked to write a description. Enter the description and press enter.
- You will be able to see the test scenario.
So, it does not support the Graphical view of the results. There is a lack of UI Result Listeners.
We can say, that in a way JMeter is a clear winner here, as it supports a variety of
modes. User can decide as per the requirements and availability of resources.
10. Cloud Load Testing:
JMeter Cloud:
There are many companies like FloodIO, RedLine 13, HP Storm Runner, etc that support cloud load testing for JMeter. All of them provide a facility to scale load tests in the Cloud and provides basic reporting.
Gatling Cloud:
Companies mentioned above also support the Gatling Tool. The Exception to this is HP Storm Runner. Gatling Frontline is a defacto standard for running Gatling tests in the cloud.
We can say, JMeter is a winner here as Apache JMeter is supported by majority of companies in the market for load testing in the cloud.
After such a thorough and detailed comparison, I think it is pretty clear that each tool has its own pros and cons. It simply depends upon your project resources and requirements, which tool to use.


%201.png)

