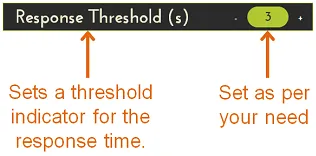
On the configuration page of URL/JMX test, set your target Response Time SLA. Say, you want to be notified, if your application's average response time is exceeding 1 second during load test run, simply enter that threshold under 'Response Threshold' in Load Scenario Settings.
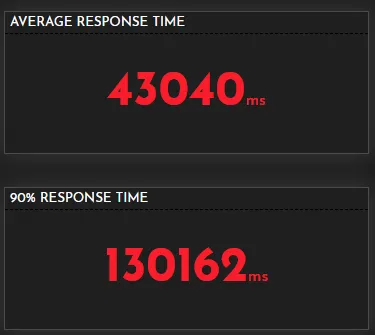
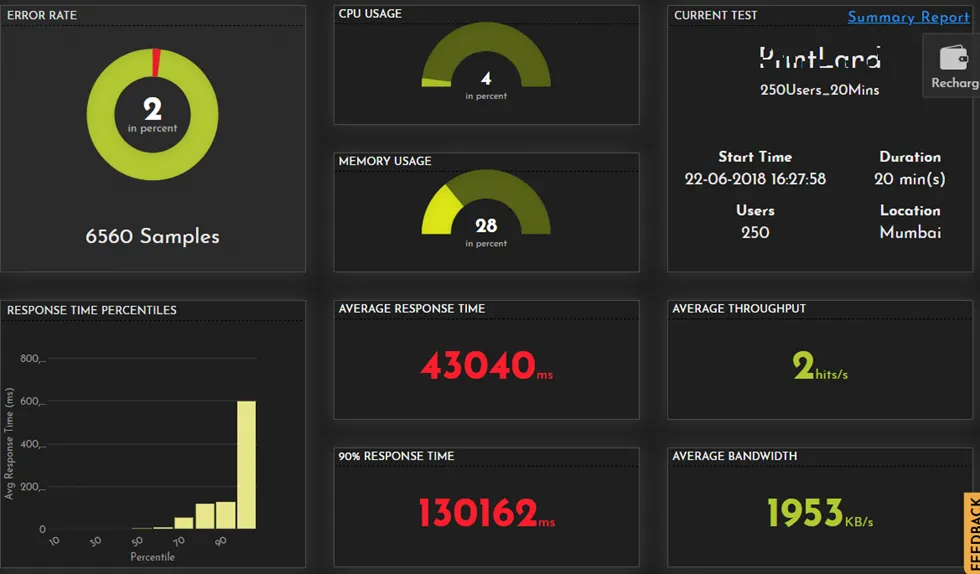
Now save and start your test, and soon you will see dashboard showing real time results from load test. If the average response time goes beyond the threshold you had set, Average and/or 90% response time tiles will change colour to Red.
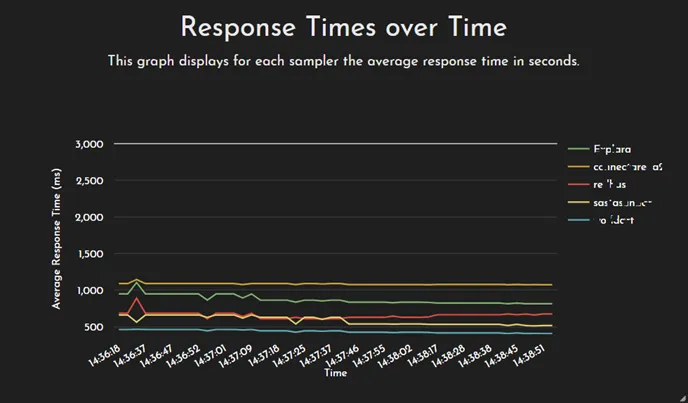
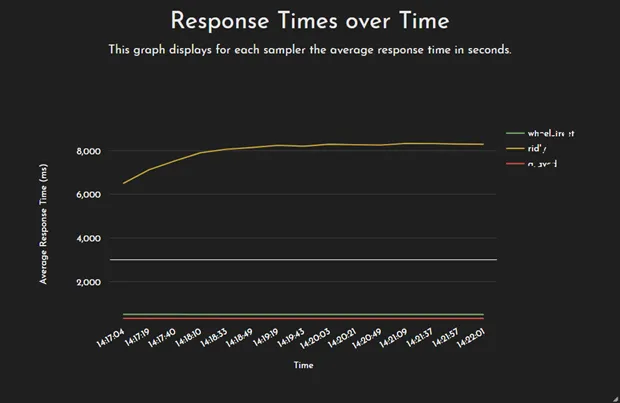
On opening Average Response Time detailed Graph by clicking the tile on dashboard, you can see white horizontal line which depict the Response Time Threshold you had set. If some URL goes beyond SLA, it will be above this white line and vice versa.
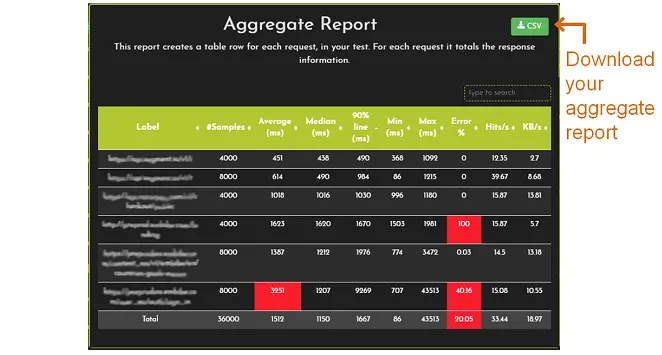
Now open, Aggregate Report table by clicking any of the 4 small tiles with numbers.
Similarly, here also, if the average response time goes beyond the threshold you had set, Average and/or 90% response time cells will change their colour to Red. Also, if error rate for any Label goes beyond 5%, that cell will become Red indicating problem areas.
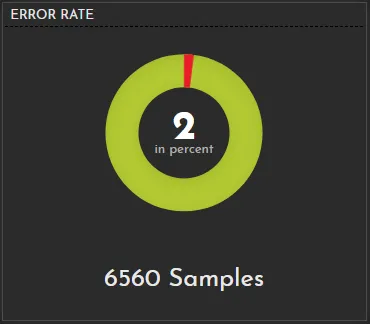
Now, check the 'Error rate' Pie chart tile on the dashboard. It will also start turning Red if errors are more.
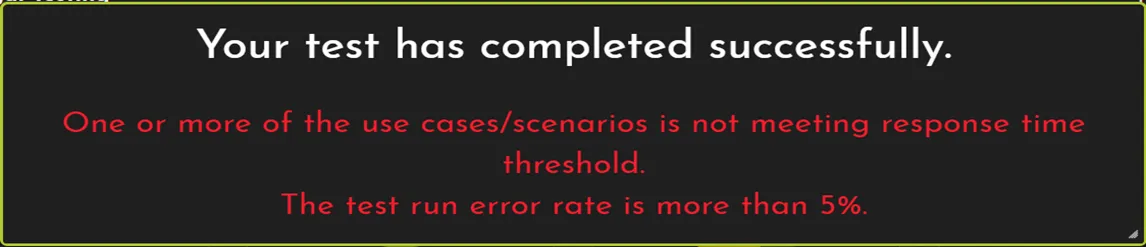
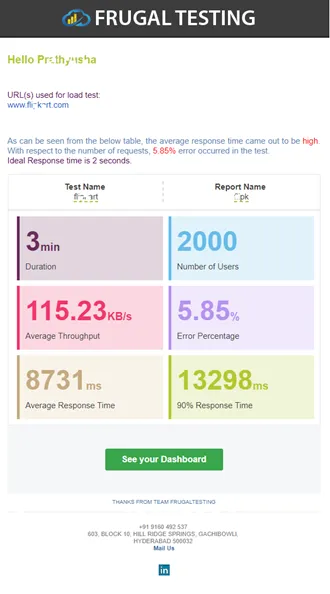
Similarly 'Summary Report' popup and 'Summary Email' will show good or bad indications accordingly on test completion.