In software engineering, debugging is an essential procedure that aids engineers in locating and fixing coding mistakes. However, what precisely is debugging? Debugging, to put it simply, is the process of identifying and resolving errors or problems in software.
The debugging definition extends beyond just identifying problems; it involves using various debugging tools and debugging software to analyze and correct software malfunctions.

The debugging steps typically include reproducing the issue, isolating the bug, and applying a fix. Chrome debugging and android debugging tools are commonly used in web and mobile app development.
Additionally, web debugging tools and coding debugging techniques are essential for ensuring efficient performance. For debugging in software testing or in software engineering, mastering these software debugging techniques is vital for delivering high-quality applications. Debugging is truly the backbone of smooth and error-free software development.
Here’s what’s coming up in this blog:
📌 What is Debugging? – Learn the core concept and importance of debugging.
📌 Who Invented "Debugging"? – Discover the history behind the term "debugging."
📌 Key Debugging Steps – Understand the essential steps in the debugging process.
📌 Top Debugging Tools – Explore tools like Chrome debugging and Android debugging tools.
📌 Effective Debugging Techniques – Master software debugging techniques for fast bug fixes.
Introduction to Debugging: Definition and Importance
In software engineering, debugging is a basic procedure used to find, examine, and correct errors or flaws in software. In simple terms, what is debugging? It’s the methodical approach to resolving issues in the code that prevent an application from running smoothly. The debugging definition encompasses both finding the root cause of the problem and applying a solution to eliminate it.

Why Debugging is Crucial in Software Development?
Software functionality, dependability, and quality are all dependent on debugging. Without it, even the smallest flaw can cause serious problems that affect functionality and user experience. The process involves using debugging tools such as chrome debugging, android debugging tools, and various web debugging tools to track down issues.
Developers may make sure that their applications function as intended and give users a flawless experience by being proficient in software testing and debugging approaches. Successful software engineering requires an understanding of and commitment to using efficient debugging techniques.
The Origin of the Term "Debugging"
During the early days of computing, the phrase "debugging" first appeared. What is the origin of the term "debugging"? It is frequently credited to 1940s computer pioneer Grace Hopper. Her team found a moth lodged in the Harvard Mark II computer, which caused an error, while they were repairing it. As a joke, Hopper called the event "debugging" the system, and the term stuck. Since then, debugging has become an essential software engineering procedure.
How Debugging Became a Standard Practice
Debugging is now a standardized procedure used by developers all over the world to find and address software problems. This procedure guarantees that code operates error-free and smoothly throughout the development and testing phases. Knowing the history of debugging puts its significance in contemporary software development in perspective, regardless of whether you're using Chrome, Android, or other debugging tools.
Difference Between Testing and Debugging
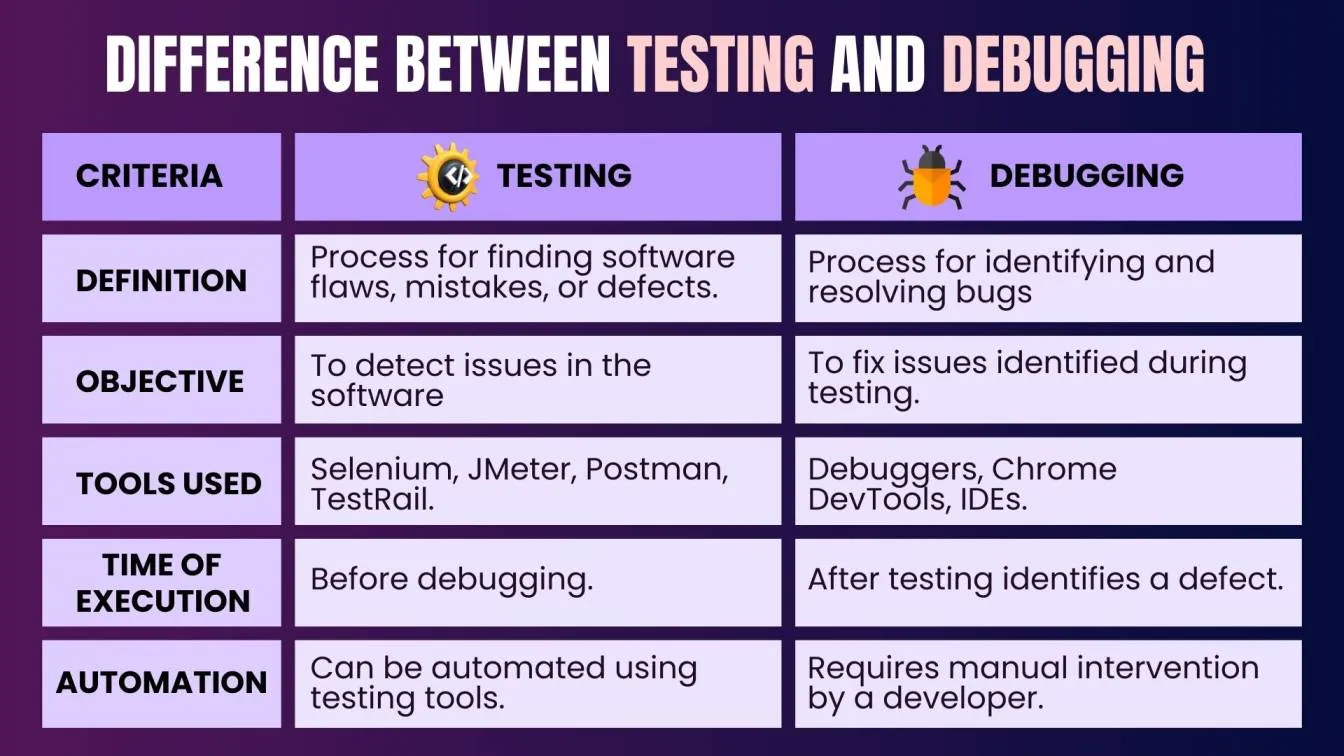
In the software development life cycle, testing and debugging are essential procedures. Debugging aims to identify and address the underlying cause of software defects, whereas testing finds them. Although they have different functions, both are essential to guaranteeing the quality of software. This is a tabular comparison between testing and debugging.
The Role of Debugging in Software Development Life Cycle
Debugging is an essential part of the Software Development Life Cycle (SDLC) and directly affects the quality and dependability of the final product. Debugging is a part of every step of the SDLC, from design and planning to deployment and maintenance. A summary of its significance at each stage is provided below:
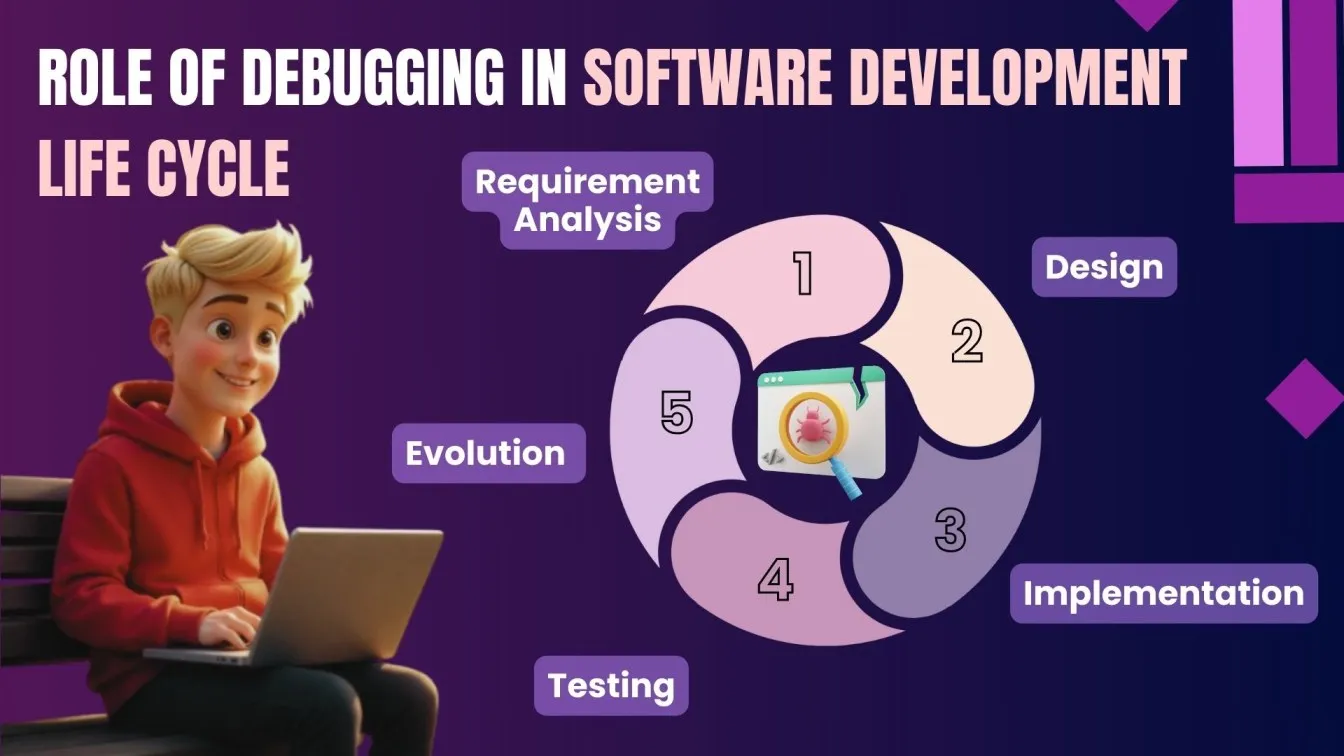
- Requirement Analysis: Debugging helps ensure technical requirements are clear and feasible, reducing potential issues in later stages.
- Design and Development: During coding, debugging tools identify errors early, ensuring clean, efficient code and preventing future problems.
- Testing: Debugging plays a crucial role in identifying and fixing bugs during unit, integration, and system testing, ensuring software quality.
- Deployment: Debugging helps troubleshoot environment-specific issues that may arise post-deployment, ensuring smooth operation.
Maintenance: Post-launch, debugging fixes newly discovered bugs and ensures the software remains functional with updates and changes.
Common Types of Software Bugs
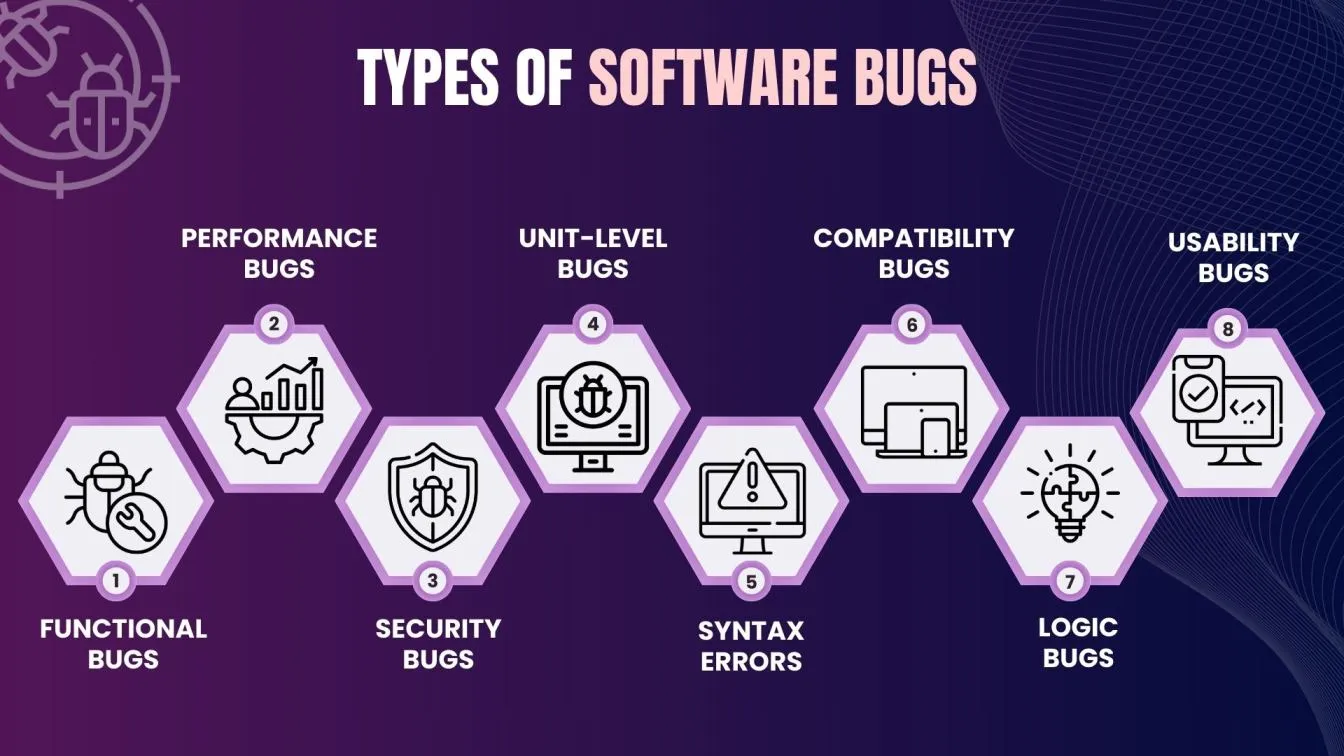
Software bugs can vary in complexity and impact. Identifying the type of bug is crucial for effective debugging and resolution. Here are some common types of software bugs:
Functional Bugs 🛠️
These bugs arise when a software feature or functionality does not function as planned. For instance, a button that does not initiate the appropriate action or a search function that yields inaccurate results.
- Example:
A "Submit" button on a form doesn't perform any action when clicked, such as submitting the form or displaying an error message if required fields are empty.
Performance Bugs ⚡
Performance issues include CPU spikes, slow load times, and high memory utilization. These problems could lead to a poor user experience, particularly in apps with high traffic.
- Example:
A website homepage takes 15 seconds to load instead of the expected 3 seconds under normal traffic conditions, causing user frustration.
Security Bugs 🔒
Fixing security flaws like SQL injection, cross-site scripting (XSS), and unauthorized data access is crucial since they put the application at risk and can lead to data breaches.
- Example:
A login page allows SQL injection attacks, such as entering admin' OR '1'='1 in the username field to gain unauthorized admin access.
Unit-Level Bugs 🧩
These bugs are present in certain software units or components. They are confined to particular code functions or methods and usually appear during unit testing.
- Example:
A function designed to calculate the sum of two numbers returns incorrect results, such as add(2, 3) returning 6 instead of 5.
Usability Bugs 🧑💻
Problems with usability affect the user experience and often result in confusion or frustration. This can include software that is challenging to use because of confusing user interfaces, unclear instructions, or poor navigation.
- Example:
A mobile app's navigation bar lacks clear labels, and users cannot figure out how to go back to the home page without closing the app.
Syntax Errors ❌
Basic coding errors, like missing punctuation, wrong keywords, or poor formatting, are known as syntax errors. These are usually simple to find and repair and stop the software from running.
- Example:
A missing semicolon in a JavaScript file:
console.log("Hello World")
Compatibility Bugs 🌐
When software doesn't work correctly across various devices, operating systems, or browsers, compatibility problems arise. These issues frequently occur when software has not been adequately tested on multiple platforms.
- Example:
A website's layout appears fine on Chrome but breaks on Safari, with text overlapping buttons and images missing.
Logic Bugs 🔄
Logic problems occur when software executes but yields inaccurate outputs because of faulty logic or inappropriate code conditions. Since these flaws don't necessarily result in crashes or other visible errors, they are frequently more difficult to find and address.
Example:
A shopping cart incorrectly calculates the total price by applying a discount to the wrong items or doubling discounts on some items.
The Debugging Process: Key Steps Involved
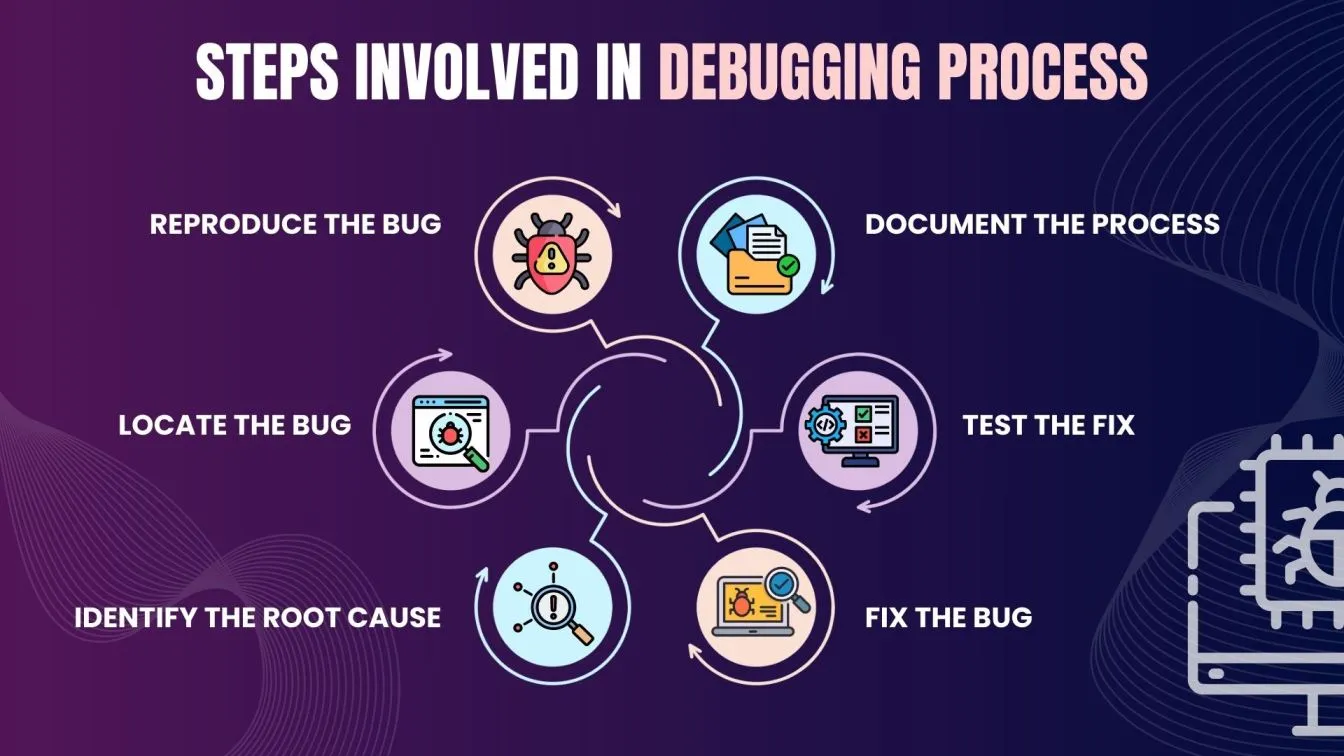
The debugging procedure is essential for finding and resolving software bugs. The main steps involved are as follows:
- Reproduce the Bug
The first step is to recreate the issue consistently. This helps understand the specific conditions under which the bug occurs and ensures it’s not a one-time glitch. - Identify the Problem
Using debugging tools and logs, developers trace the error to its source. This step involves reviewing error messages, checking logs, and understanding the flow of the program to determine where things went wrong. - Isolate the Cause
Once the issue is identified, isolating the exact cause is crucial. This may involve narrowing down the section of code or function causing the problem. - Fix the Issue
After pinpointing the root cause, developers modify the code or logic to correct the issue while ensuring that the fix doesn't introduce new problems. - Test the Fix
Tests should be performed once modifications are made to make sure the bug has been fixed without compromising other program functionalities. At this point, regression tests are frequently conducted. - Document the Solution
Once the issue is resolved, developers document the fix for future reference. This helps avoid similar issues in the future and ensures that other team members are aware of the solution.
Essential Debugging Tools for Developers
Debugging tools are essential for engineers to find and fix software faults quickly. By streamlining the debugging process, these technologies increase its effectiveness and decrease its duration. The following are some crucial debugging tools that all developers ought to use:
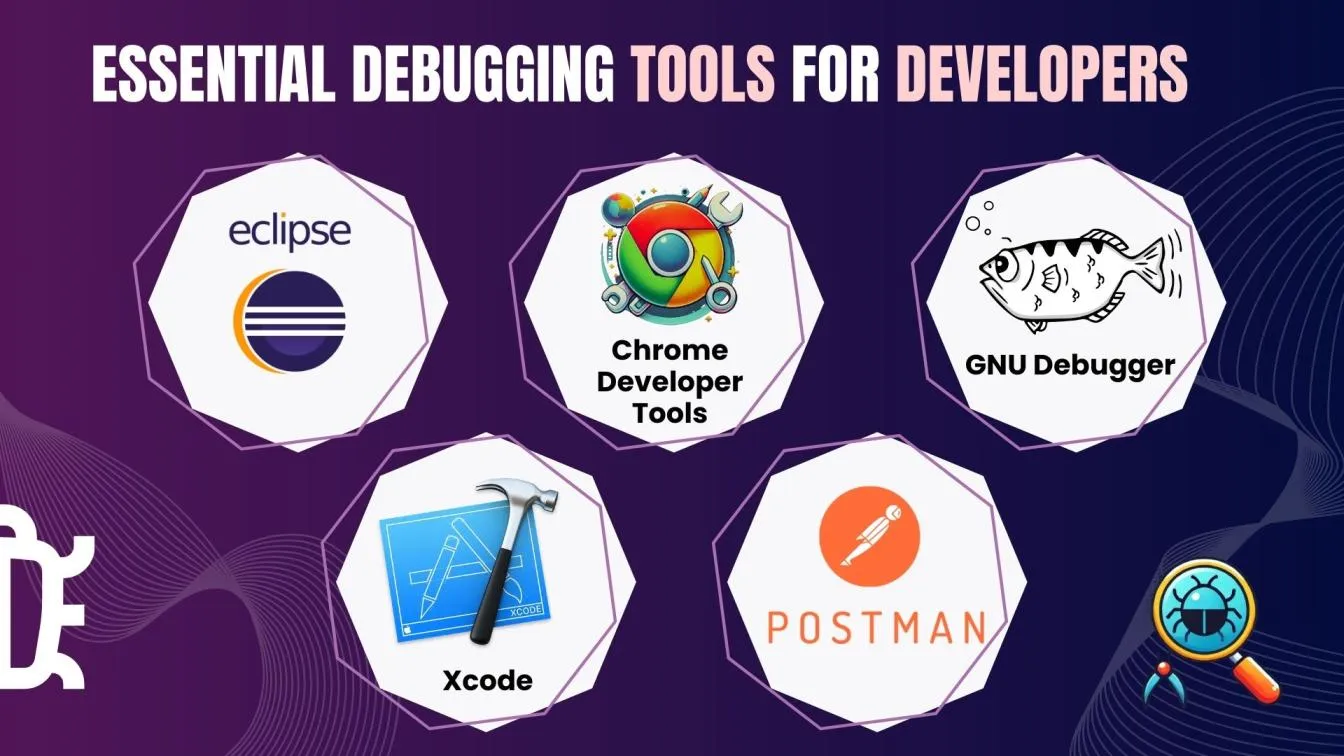
- Integrated Development Environments (IDEs)
Developers can walk through code, set breakpoints, and investigate variables by using the inbuilt debuggers found in IDEs like Visual Studio Code, Eclipse, and IntelliJ IDEA. - Chrome Developer Tools
Chrome DevTools provides strong debugging capabilities for web development, including the ability to examine HTML, CSS, JavaScript, and network queries in order to find problems in web applications. - Xcode Debugger
The debugging capabilities of Xcode are essential for developers working on iOS and macOS apps. It facilitates memory inspection, bug tracking, and code performance optimization. - GDB (GNU Debugger)
GDB is a well-known command-line debugger for C, C++, and other compiled languages. Programmers may now analyze and debug programs at the source code level thanks to this. - Postman
By examining answers, headers, and request bodies, Postman is a great tool for testing and debugging RESTful APIs.
Using the right debugging tools can significantly improve code quality and help developers resolve issues faster.
Debugging Techniques in Software Testing
Software testing requires debugging, and employing the right technique can speed up the process of identifying and resolving issues. Some frequently used debugging methods are listed below:
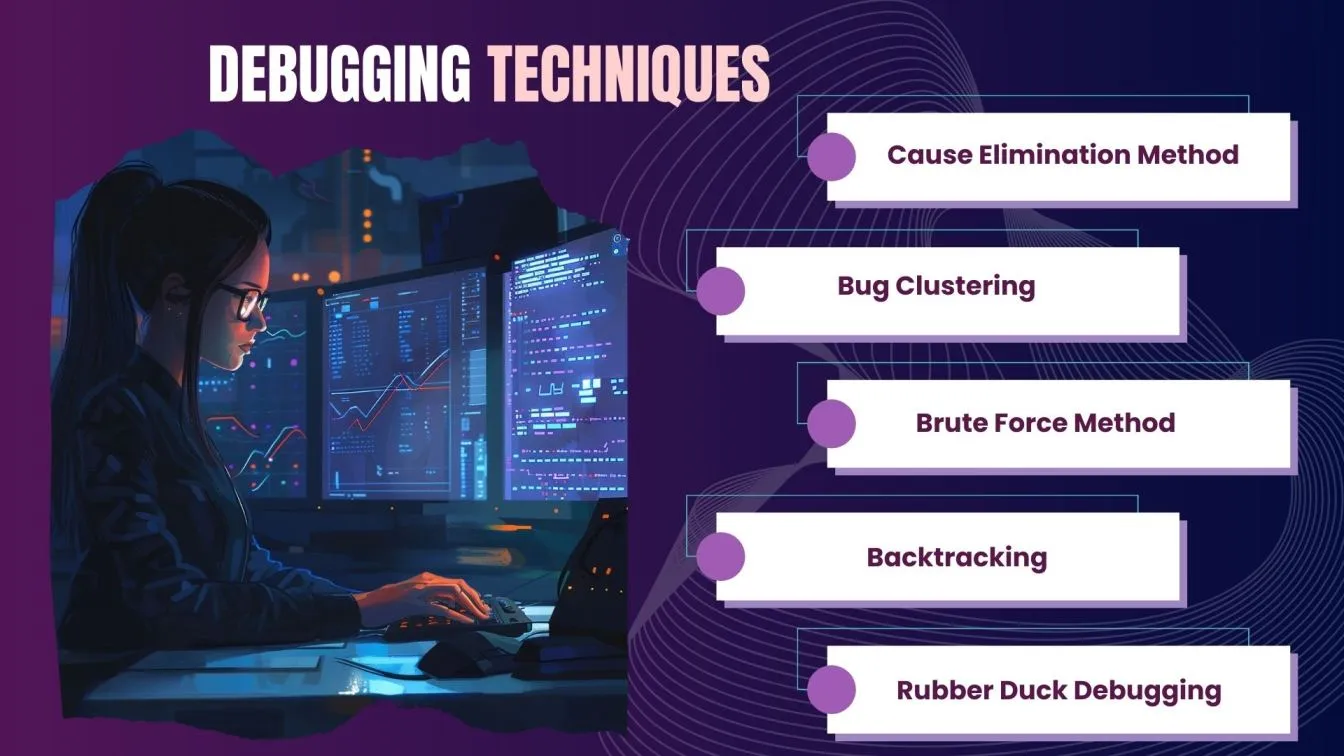
- Brute Force Method
To detect bugs, this method entails carefully going over the entire code. It takes a lot of effort, but when other approaches don't work, it can help find mistakes. - Rubber Duck Debugging
Engineers are forced to clearly express the problem when they explain it to an inanimate object, such as a rubber duck, which can aid in problem-solving. - Bug Clustering
By concentrating on the most troublesome sections of the code, this method finds the parts that are most likely to have errors. - Cause Elimination Method
In order to identify the underlying cause of the problem, developers change each component one at a time, methodically eliminating potential causes. - Backtracking
Developers can find the bug's origin and fix it more easily by retracing steps.
Web Debugging Tools for Browser-Based Applications
Debugging browser-based applications is essential for ensuring a seamless user experience. Here are some popular web debugging tools that engineers rely on:
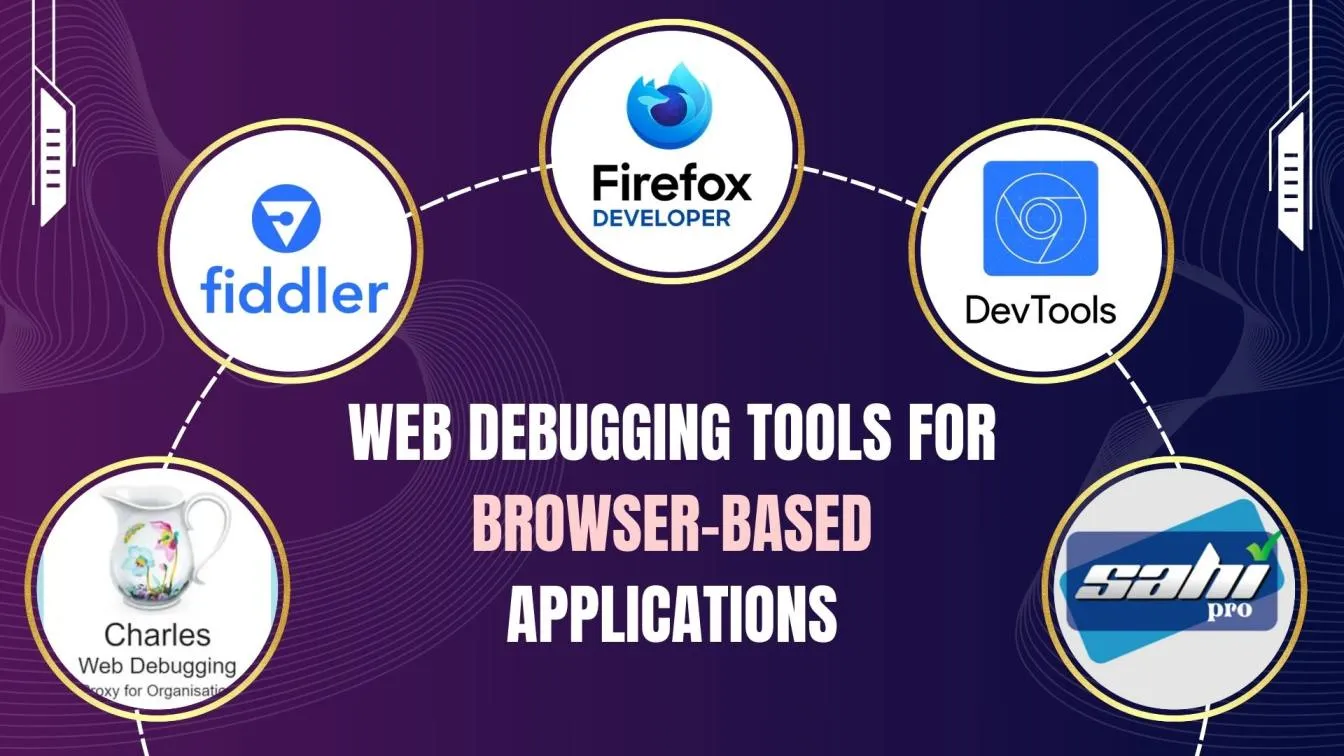
- Chrome DevTools
Chrome DevTools, which is integrated into Google Chrome, is essential for fixing problems with web applications because it provides features like real-time editing, JavaScript debugging, and performance profiling. - Firefox Developer Tools
These tools give engineers access to powerful features that guarantee browser compatibility and performance, like network monitoring, HTML/CSS inspection, and JavaScript debugging. - Fiddler
By capturing HTTP and HTTPS traffic, Fiddler enables engineers to examine data flow, spot performance snags, and instantly identify security flaws. - Charles Proxy
With the aid of this cross-platform debugging proxy, HTTP, HTTPS, and HTTP/2 traffic can be examined. It offers information about requests and answers, which helps troubleshoot complicated problems. - Sahi Pro
Sahi Pro, which was created for web test automation, makes debugging easier with features like test distribution, customizable reports, and compatibility with contemporary web technologies.
Using these tools ensures efficient debugging, helping developers deliver robust browser-based applications.
Android Debugging Tools for Mobile App Quality
Robust debugging tools are necessary for creating high-quality Android applications in order to quickly detect and fix problems. With the use of these technologies, engineers may improve user experience, guarantee reliability, and maximize app speed. For Android developers, the following debugging tools are crucial:
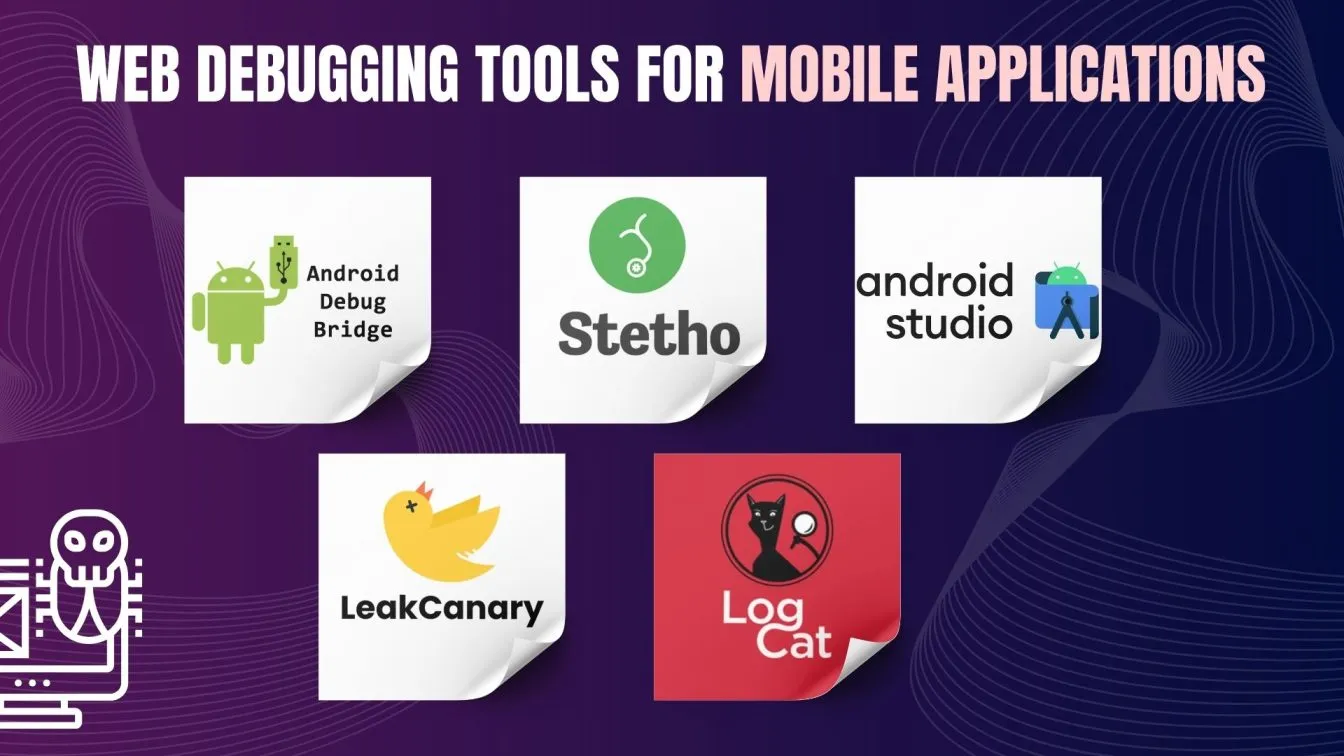
- Android Debug Bridge (ADB)
ADB is a command-line utility that allows engineers to install apps, debug, and run commands on Android devices. It is useful and necessary for testing and debugging apps. - Android Studio Debugger
This debugger, which is integrated into Android Studio, enables engineers to examine the execution flow of Java, Kotlin, and native C/C++ code, set breakpoints, and investigate variables. - Logcat
Engineers may track app behavior with Logcat, a tool for viewing device-generated logs, including error messages and custom logs. - Stetho
Stetho is an open-source tool from Facebook that allows you to examine view hierarchies, databases, and network calls in Android apps by connecting them to Chrome DevTools. - LeakCanary
This library automatically finds memory leaks and offers thorough reports to assist in resolving memory management problems.
Coding Debugging Best Practices
Debugging is a critical skill for engineers to ensure high-quality and efficient software. Here are some best practices:
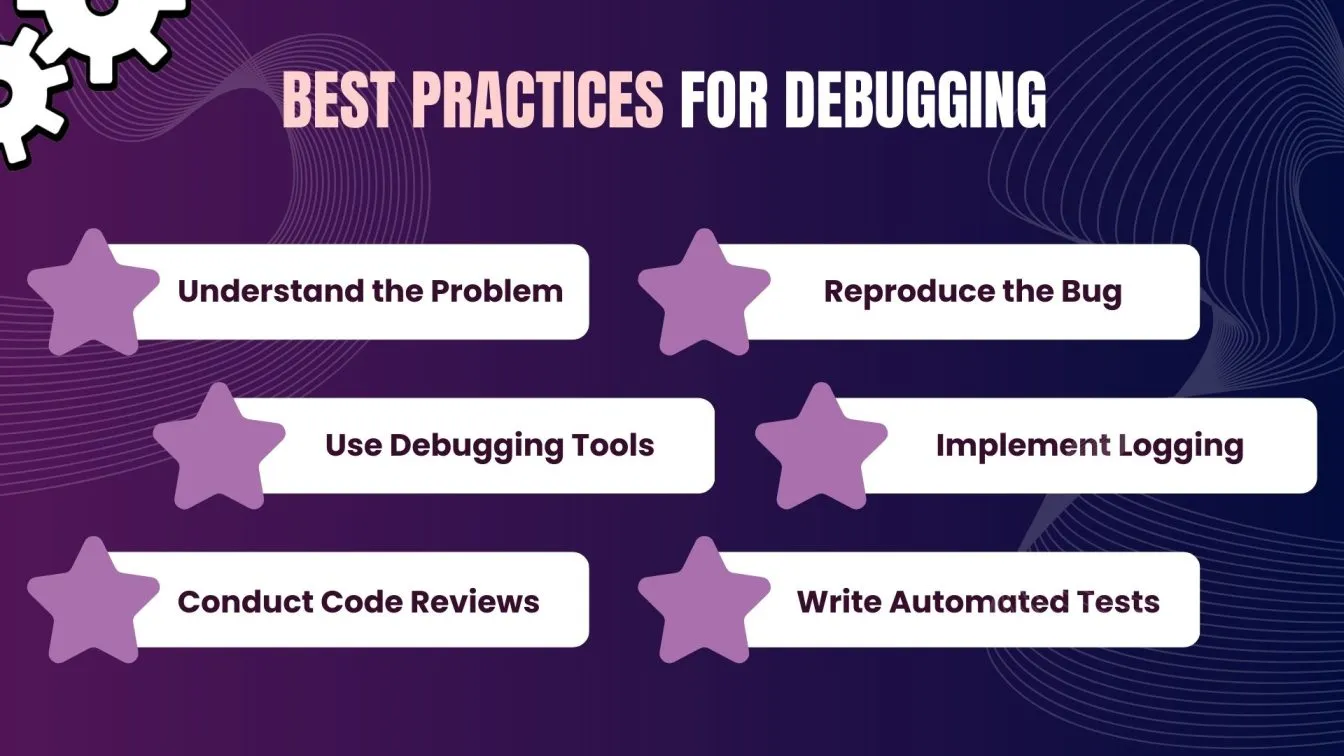
- Understand the Problem
Clearly define the issue by analyzing error messages and user reports before diving into the code. - Reproduce the Bug
Consistently replicate the issue in a controlled environment to observe and test potential fixes effectively. - Use Debugging Tools
Leverage IDEs with built-in debuggers to set breakpoints, inspect variables, and track code execution. - Implement Logging
Add log statements to monitor the application’s behavior and trace the sequence of events leading to the bug. - Conduct Code Reviews
Collaborate with peers to identify potential problems early and gain new perspectives on solutions. - Write Automated Tests
Use unit and integration tests to catch bugs early and prevent regressions.
By following these practices, debugging becomes more systematic and effective.
Challenges in Debugging Complex Software Systems
Debugging intricate software systems can be an overwhelming endeavor, particularly as these systems expand in size and complexity. Below are some of the primary challenges that engineers encounter:
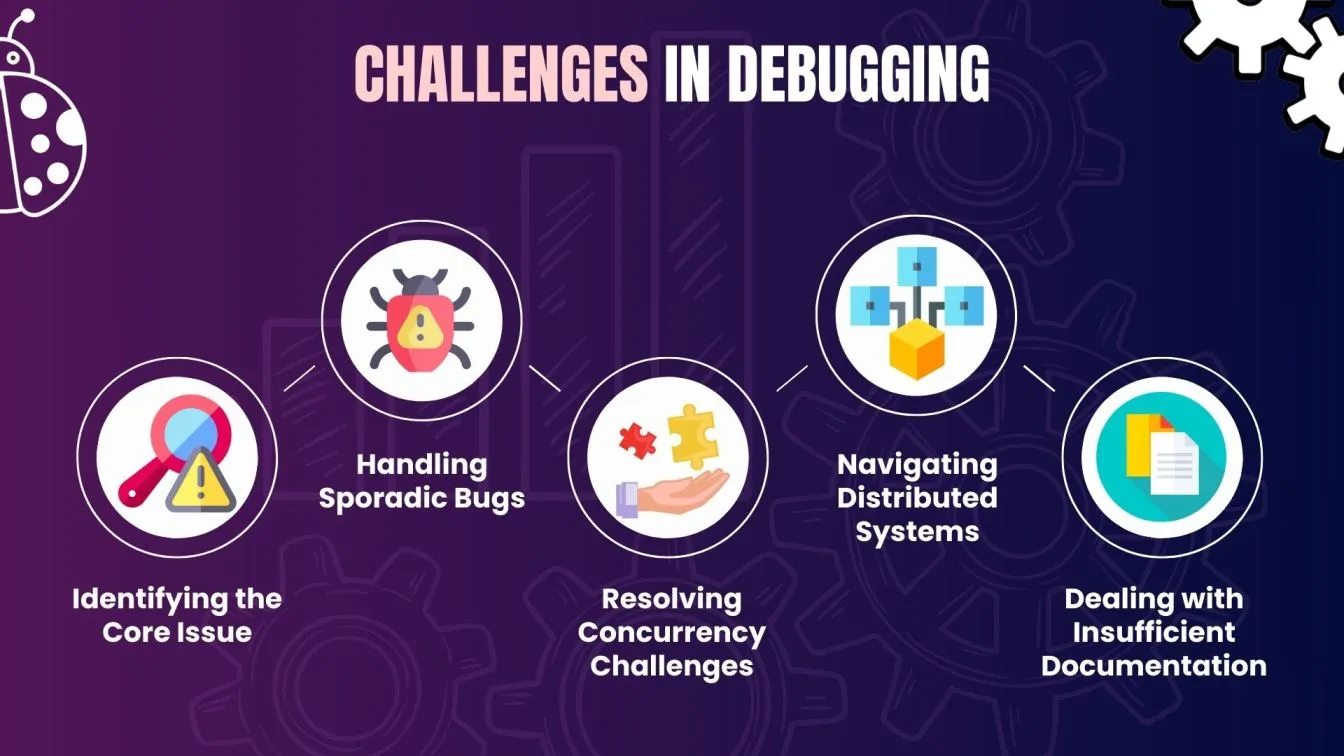
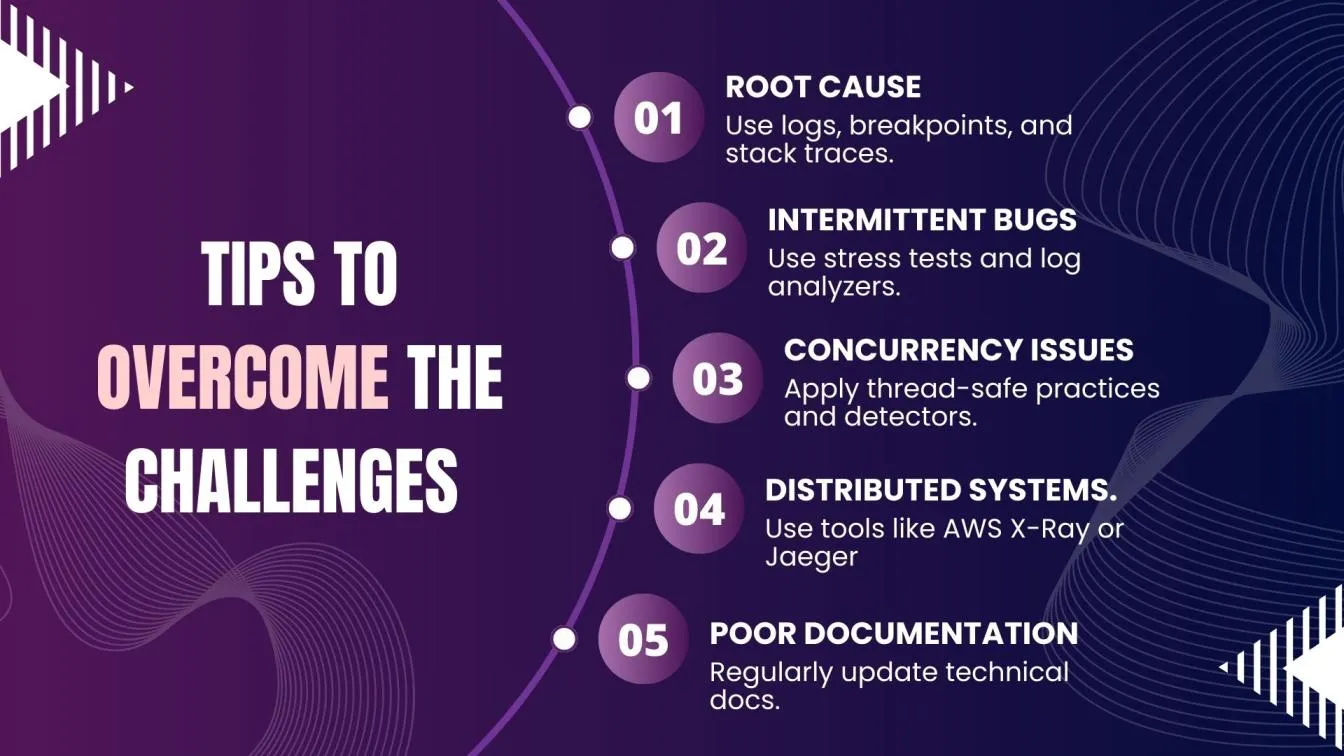
- Pinpointing the Root Cause:
In extensive systems with interdependent components, identifying the precise origin of a bug can be labor-intensive, necessitating thorough code tracing and examination. - Addressing Intermittent Bugs:
Random issues that manifest under certain conditions are hard to replicate, rendering them difficult to diagnose and rectify. - Managing Concurrency Problems:
In multi-threaded or concurrent environments, issues such as race conditions or deadlocks can lead to unpredictable behavior, complicating the debugging effort. - Traversing Distributed Architectures:
Debugging within distributed systems presents difficulties due to numerous components functioning in various environments, which complicates the tracking of data flow. - Contending with Inadequate Documentation:
Insufficient or outdated documentation obstructs comprehension of system functionality, thereby making debugging more difficult.
Future Trends in Debugging Tools and Techniques
The realm of debugging tools and methods is swiftly changing, propelled by technological advancements and the growing intricacy of software systems. Significant trends influencing the future encompass:
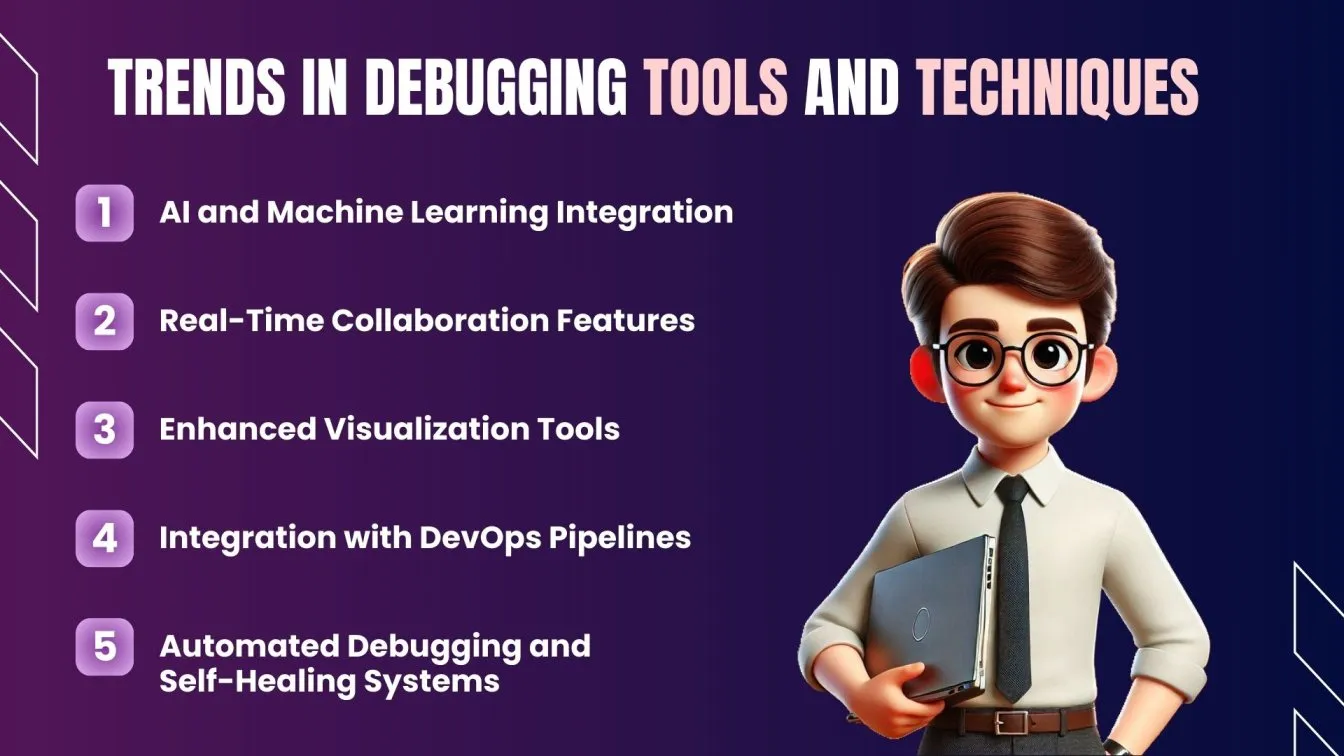
- AI and Machine Learning Integration
Artificial intelligence is revolutionizing debugging by streamlining bug identification and analysis. AI-driven tools scrutinize code patterns to forecast and recommend solutions, boosting efficiency and precision. - Real-Time Collaboration Features
As remote work becomes more prevalent, debugging tools now incorporate real-time collaboration, allowing numerous developers to address problems concurrently, thus speeding up the debugging workflow. - Enhanced Visualization Tools
Sophisticated visualization assists in comprehending intricate codebases by depicting dependencies and execution paths, enabling quicker pinpointing of problems. - Integration with DevOps Pipelines
Contemporary debugging tools are smoothly merging into DevOps processes, facilitating ongoing monitoring and prompt bug resolution throughout the development phase. - Automated Debugging and Self-Healing Systems
Newly emerging systems can autonomously identify and rectify specific types of bugs, lessening the necessity for human intervention and enhancing software dependability.
These trends are collectively improving the efficiency of debugging practices, resulting in sturdier and more dependable software development.
Signing off!
Debugging is a vital skill for software engineers, ensuring that every software program runs smoothly and fulfills its intended purpose. From static analysis to manual debugging, the process of debugging spans a wide range of techniques, addressing runtime errors, logic errors, and even semantic errors.
By incorporating practices like code reviews, unit tests, and dynamic analysis tools, engineers can tackle complex issues and prevent potential errors from impacting the software product.

Debugging tools with built-in debugging tools and remote debugging capabilities have revolutionized the software development lifecycle, helping resolve performance bottlenecks and security vulnerabilities.
These tools streamline the development process, reduce debugging time, and enhance user satisfaction by ensuring optimal software functions.
Integrating these methods into the testing process, along with proper handling of user input and lines of code, helps engineers create robust applications and maintain the reliability of their systems.
People Also Ask
👉What is the difference between debug and bug?
A bug is a flaw or error in the software, while debugging is the process of identifying and fixing that flaw by analyzing the flow of execution.
👉Why is debugging so difficult?
Debugging is a challenging task due to the need to trace potential sources of errors across complex systems with many dependencies.
👉What is the debugging life cycle?
The debugging life cycle involves identifying the bug, reproducing it, isolating the issue, resolving it, and verifying the fix to ensure smooth execution flow.
👉Which comes first testing or debugging?
Testing comes first to find errors, followed by debugging to locate and fix the potential sources of those errors.
👉What is an example of debugging?
An example of debugging is identifying and fixing a "null pointer exception" error in a Java program that occurs when trying to access an object that has not been initialized.



%201.webp)
