The foundation of flawless digital experiences is API performance, and it is more important than ever to make sure it satisfies the highest standards. JMeter performance testing can help with that. One of the most reliable software performance testing tools, Apache JMeter, lets you assess the robustness, scalability, and resilience of your APIs in practical settings.
In this guide, we'll cover everything you need to know about using JMeter for API performance testing. First, we'll look at what makes JMeter a popular option for testers and how to effectively set it up on Windows and other platforms. You will discover how to design efficient JMeter test plans, set up the tool to produce precise performance outcomes, and examine important metrics to spot bottlenecks.
we'll also go over more sophisticated methods, like integrating JMeter with other tools for better automation and reporting, or scaling JMeter tests for bigger applications. We'll go over common problems and highlight best practices for performance testing to make sure your APIs stand out in the current competitive landscape. Regardless of your level of experience, this guide is packed with helpful tips and insights to help you become an expert in JMeter API testing. Let's get started and improve, the speed, and dependability of your APIs!
Why you shouldn't miss this blog!
📌 Learn JMeter performance testing basics and why it’s essential.
📌 Step-by-step guide to setting up and creating your first test plan.
📌 Tips for configuring JMeter and analyzing performance metrics.
📌 Explore advanced techniques and integrations with other tools.
📌 Discover best practices, challenges, and future trends in JMeter testing
Introduction to JMeter Performance Testing
Understanding JMeter performance testing is crucial if you want to make sure your APIs operate dependably in real-world scenarios. Apache JMeter is a robust, open-source tool that helps you find performance bottlenecks before they affect users by simulating high loads on servers, apps, and APIs.
JMeter is one of the top open-source performance testing tools with extensive load and stress testing capabilities. Its application window, or interface, makes it easy to set up test plans.
Teams of all sizes can use JMeter because it provides an affordable performance testing solution. We'll walk you through every step of getting started with JMeter in this guide, from the fundamentals to the more sophisticated features.
We'll go over why JMeter is the best tool for testing API performance, how to configure it, and how to write efficient test plans that replicate your actual traffic. Additionally, you will learn how to configure JMeter in a way that will guarantee accurate and useful results. This overview will lay the groundwork for a successful journey into JMeter testing and performance optimization, regardless of your level of experience.
Setting Up Apache JMeter for Effective Performance Testing
Apache JMeter is simple and easy to set up on a Windows computer. To begin, follow these steps:
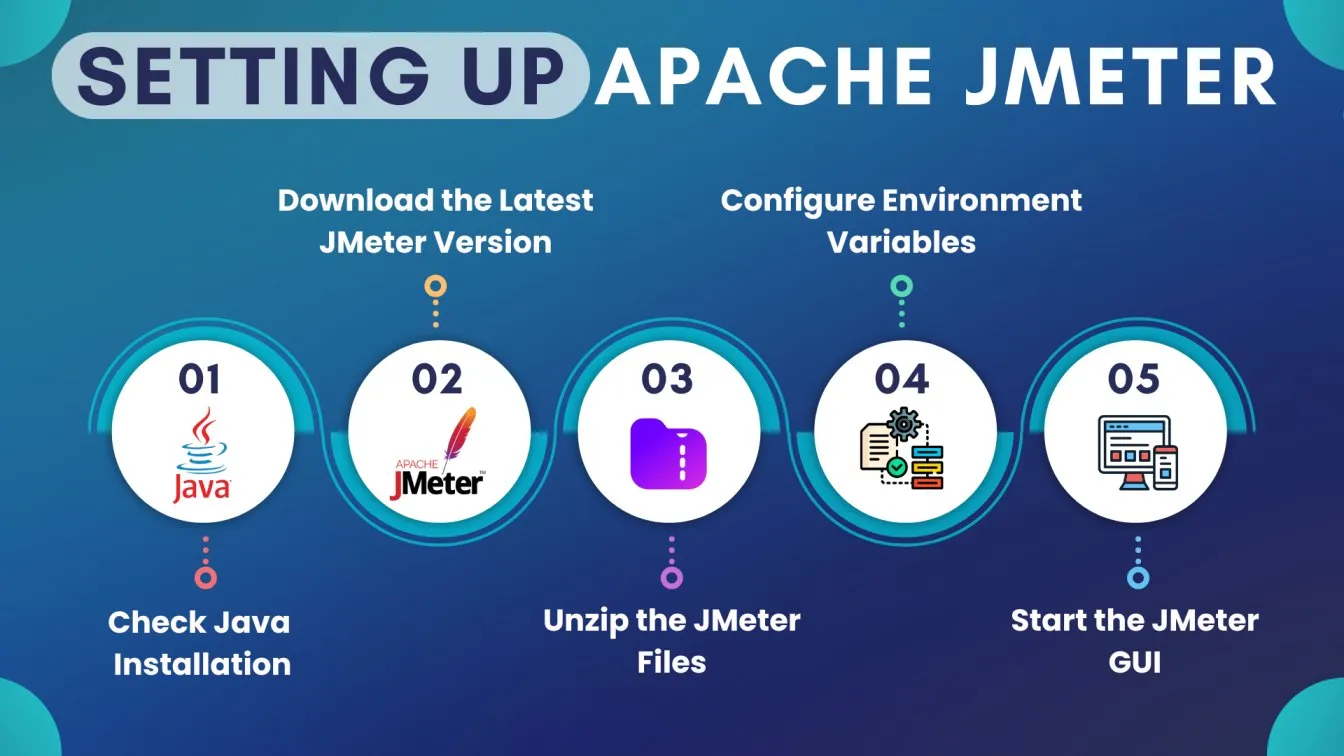
- Verify the Java installation: Initially, confirm that Java (JDK 8 or later) is installed. Type java -version into the Command Prompt. Install Java from the official Oracle website if it isn't already installed.
- Download JMeter: Download the most recent binary zip file from the official Apache JMeter download page.
- Extract the Files: Once downloaded, unzip the JMeter package into a folder. This will be your JMeter home directory.
- Set Up Environment Variables: For smooth operation, add the JMeter bin directory to your system's PATH environment variable.
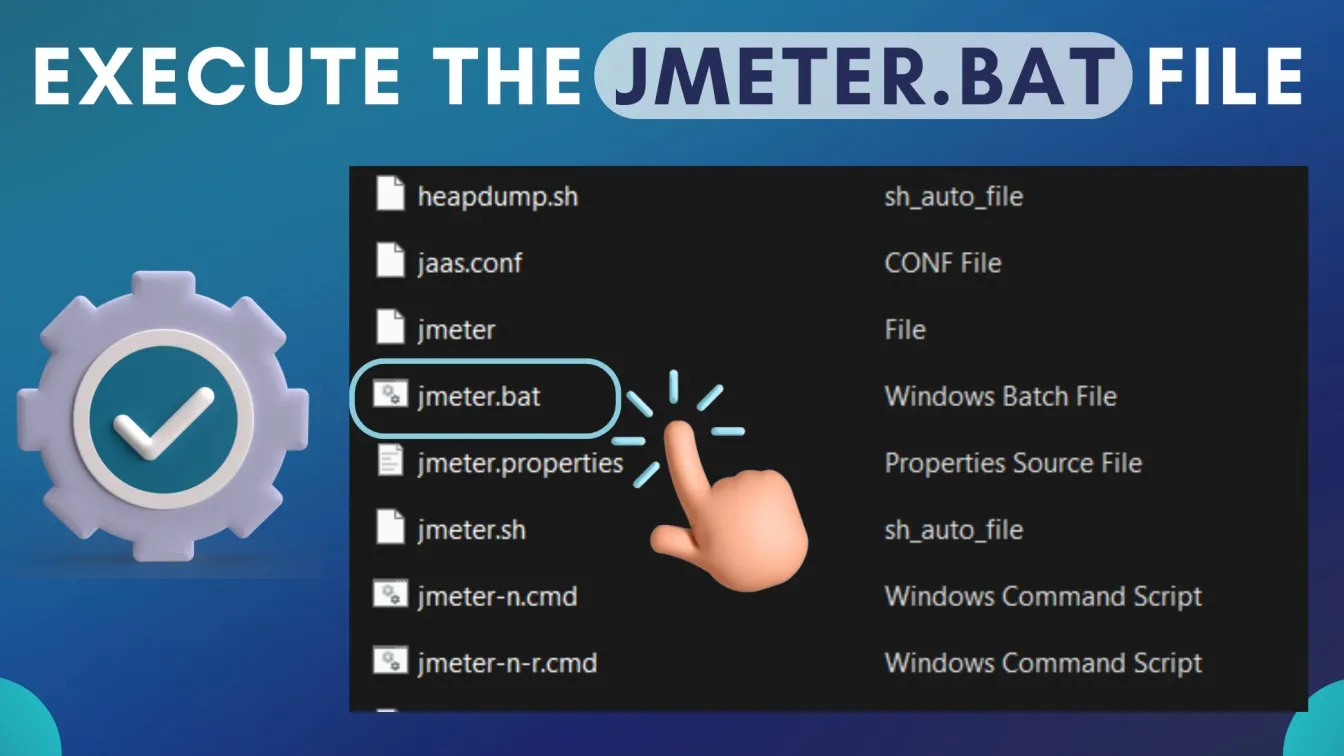
- Launch JMeter: Open the bin folder and run jmeter.bat (on Windows) or jmeter.sh (on Linux/Mac) to start the JMeter GUI.
That's it! You can now use JMeter on your Windows computer to create test plans and perform performance testing.
Creating Your First JMeter Test Plan for Performance Evaluation
Creating your first JMeter test plan for performance evaluation is a straightforward process. Follow these steps:
- Launch JMeter: Open the JMeter GUI by executing the jmeter.bat file located in the bin directory.
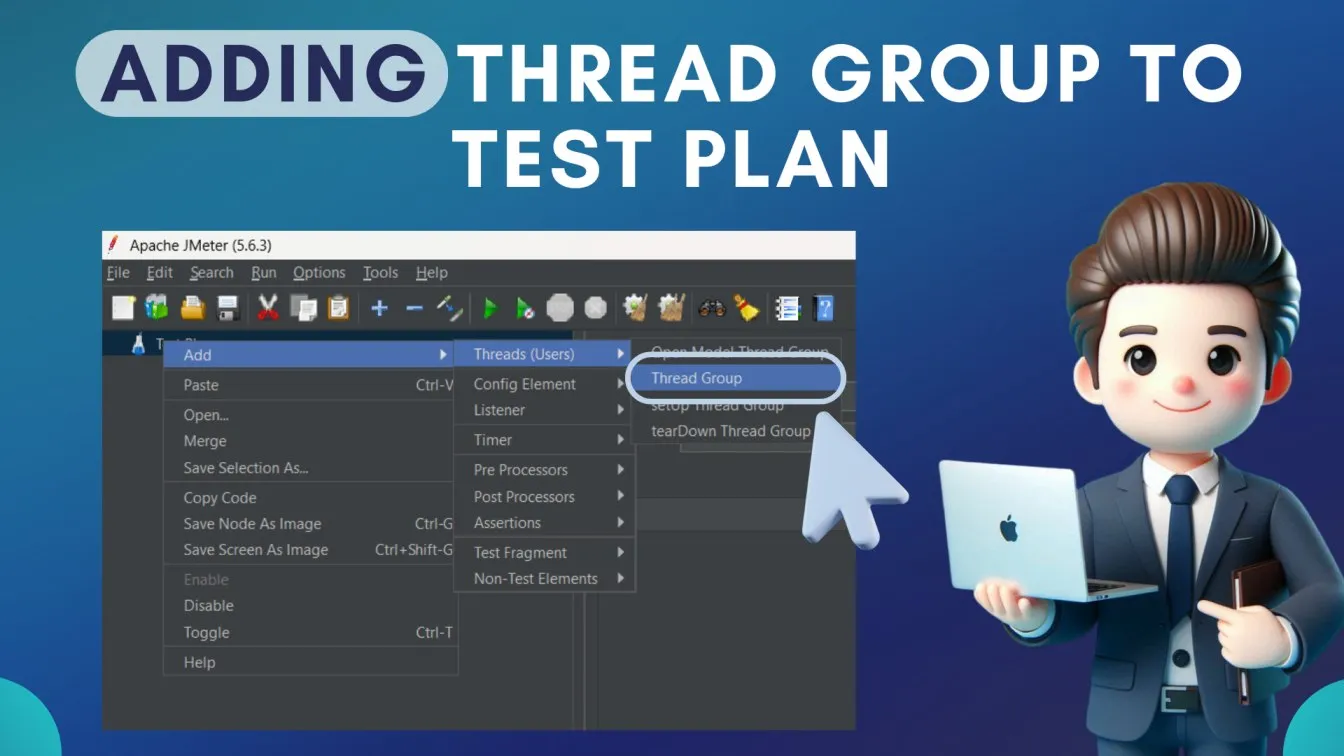
- Create a Test Plan: In the JMeter interface, right-click on the Test Plan node, and select Add > Threads (Users) > Thread Group. This defines the number of virtual users and the test's execution parameters.
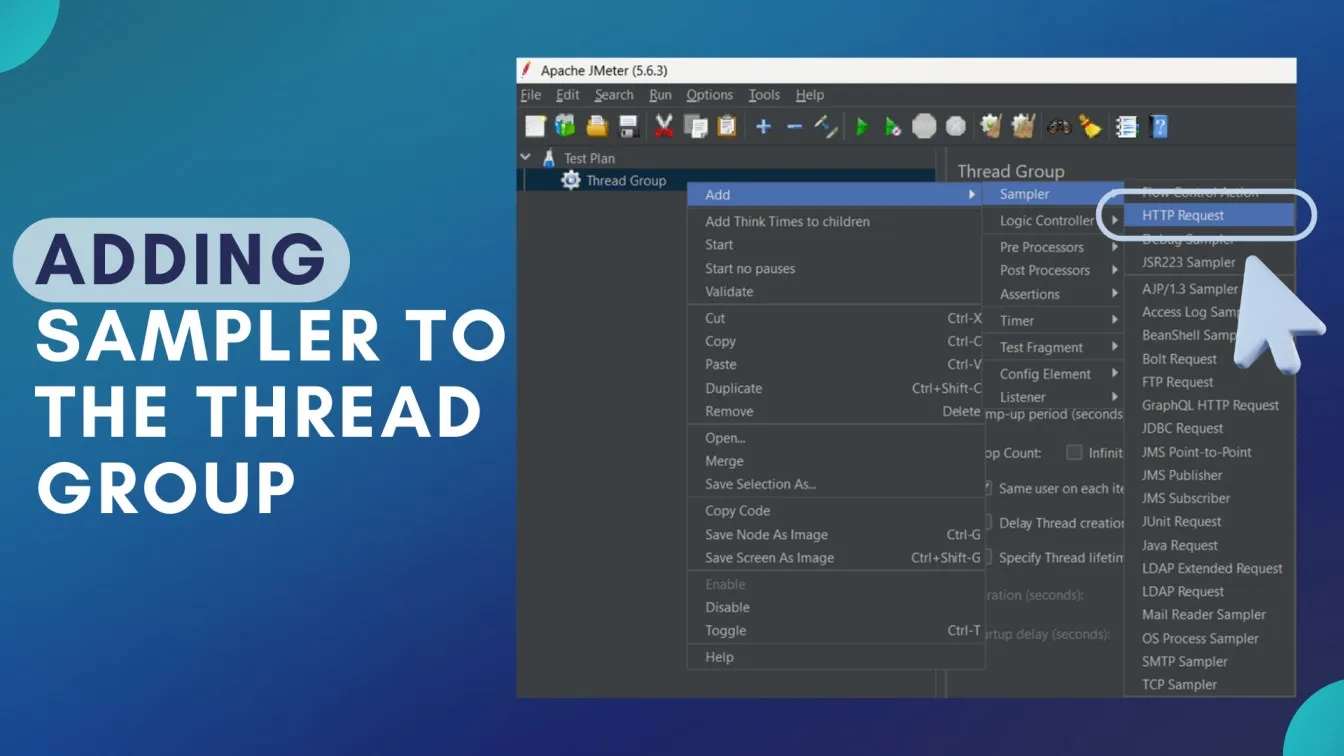
- Add Samplers: Within the Thread Group, right-click, and choose Add > Sampler > HTTP Request. Configure the HTTP request with the target server's details, including the protocol, server name, and path.
- Include Listeners: To monitor and analyze test results, right-click on the Thread Group, and select Add > Listener > View Results Tree. Listeners capture and display the responses from your test executions.

- Run the Test: Click the Start button (green triangle) on the toolbar to execute the test plan. Monitor the results in the View Results Tree to assess performance metrics.
Configure API requests in the HTTP Request sampler to evaluate your backend system's performance. Proper setup of listeners and Thread Groups is essential for the smooth execution of tests and accurate result analysis. By following these steps, you can effectively create and execute a JMeter test plan to evaluate your application's performance.
Configuring JMeter for Accurate Performance Testing Results
To ensure accurate performance testing results with Apache JMeter, follow these essential configuration steps:
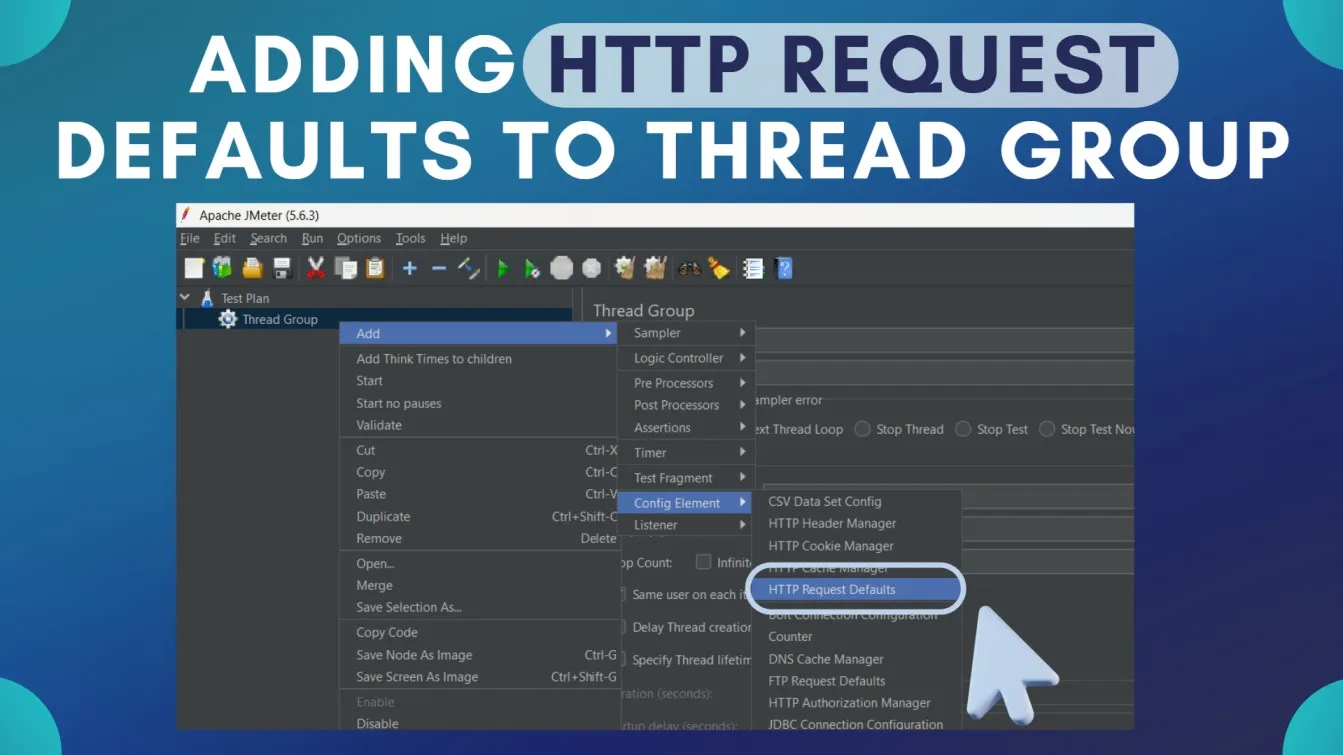
- Set Up HTTP Request Defaults: Within your Test Plan, right-click and select Add > Config Element > HTTP Request Defaults. Input your server's protocol, name, and port to standardize requests and minimize redundancy. The HTTP Request element is a core component for simulating API interactions in JMeter
- Implement Timers: Incorporate timers like the Constant Timer to simulate real user think times, preventing unrealistic, rapid-fire requests. Right-click on your Thread Group, choose Add > Timer > Constant Timer, and set an appropriate delay.

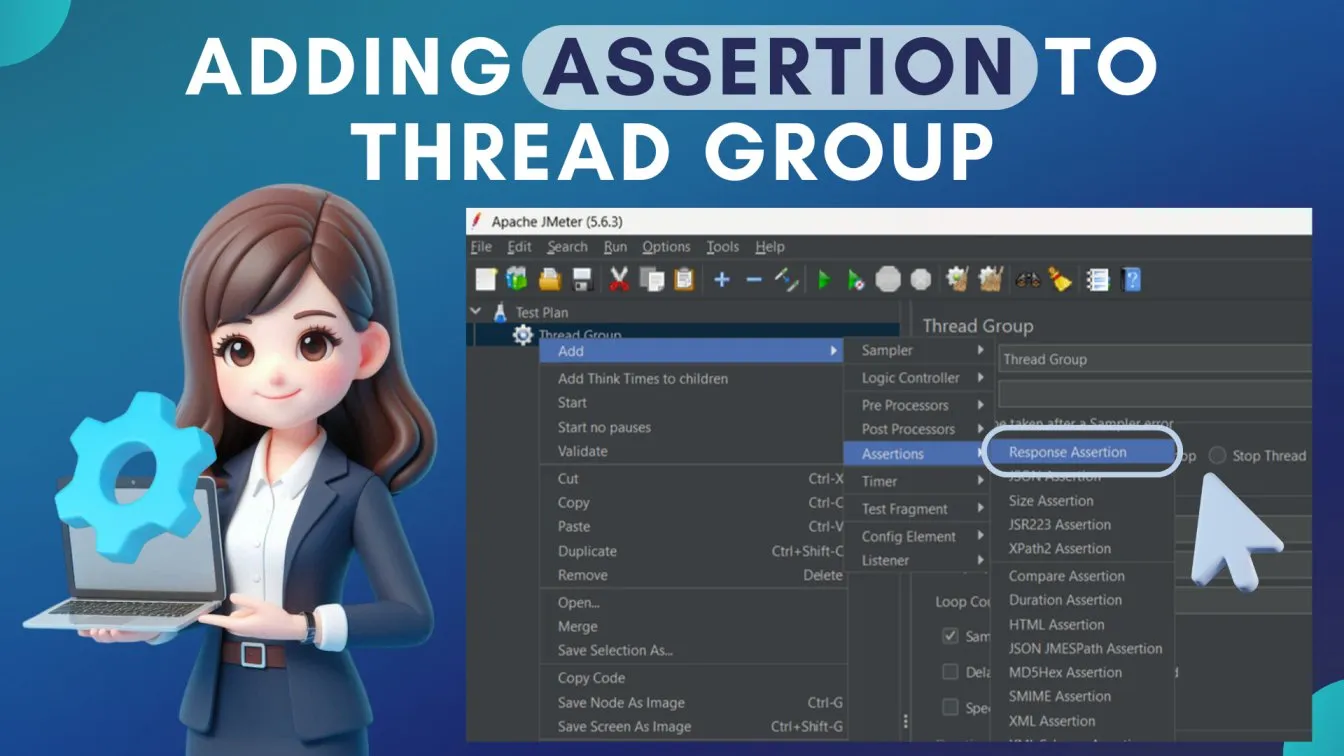
- Use Assertions: Add Response Assertions to validate server responses, ensuring they meet expected criteria. Right-click on your HTTP Request, select Add > Assertions > Response Assertion, and define the expected response patterns.
- Configure Listeners Wisely: While Listeners like View Results Tree are useful during test development, they can consume significant resources. For large-scale tests, opt for Simple Data Writer to log results efficiently.
- Adjust Thread Group Settings: Fine-tune the Number of Threads, Ramp-Up Period, and Loop Count in your Thread Group to mirror realistic user load and behavior patterns.
For dynamic testing, use CSV Data Set Config to load user records into your JMeter test plan. Configuring HTTP Request Defaults and Response Assertions allows for deep data analysis, ensuring comprehensive performance insights.
Analyzing JMeter Test Results: Key Metrics and Insights
It is essential to examine JMeter test results in order to comprehend the performance of your application. Keep an eye on these important metrics:
- Response Time Metrics:
- Average: The mean time taken for requests.
- Median: The middle value in the response time dataset.
- 90th Percentile: The response time below which 90% of the requests fall, indicating consistency.
- Throughput:
- Measures the number of requests processed per second, reflecting the system's capacity to handle load.
- Error Rate:
- The percentage of failed requests. A high error rate signals potential issues in the application or test configuration.
- Latency:
- The time from sending a request to receiving the first byte of the response, highlighting network delays.
- Connect Time:
- The duration to establish a connection with the server, is essential for diagnosing network-related performance issues.
JMeter’s Aggregate Report and graphical listeners provide an in-depth analysis of key metrics like throughput, latency, and error rates. Finding bottlenecks and improving application performance is made easier with regular monitoring and analysis of these insights. Metrics like latency and throughput can reveal bottlenecks in application hardware. These detailed execution reports help identify areas for performance optimization.
Advanced JMeter Techniques for Enhanced Performance Testing
Use these sophisticated strategies to improve your Apache JMeter performance testing:

- Setting parameters:
To improve test realism and simulate real-world user interactions, use the CSV Data Set Config element to input dynamic data.
- Correlation
To ensure precise session handling and data flow, use Regular Expression Extractors to record dynamic server responses.
- Testing in a distributed manner:
Use JMeter's distributed testing features to spread the load among several computers so that extensive performance analyses are possible.
- Using JSR223 to script:
Incorporate sophisticated logic and unique features into your test plans by integrating JSR223 Samplers with programming languages such as Groovy.
- Connecting CI/CD Pipelines:
Using tools such as Jenkins, integrate JMeter tests into workflows for Continuous Integration and Continuous Deployment to enable automated performance testing.
Customization in testing processes, such as using User Defined Variables and advanced scripting, enables precise simulation of real-world conditions in JMeter tests. By using these strategies, you can carry out more thorough and accurate performance evaluations, which will yield more profound insights and more effective optimization strategies. Including parameters in User Defined Variables simplifies test customization and improves scalability
Integrating JMeter with Other Performance Testing Tools
Integrating Apache JMeter with other performance testing tools can significantly enhance your testing workflow and analysis capabilities. JMeter can test internal applications by simulating API requests under various load conditions. Here’s how you can do it effectively :
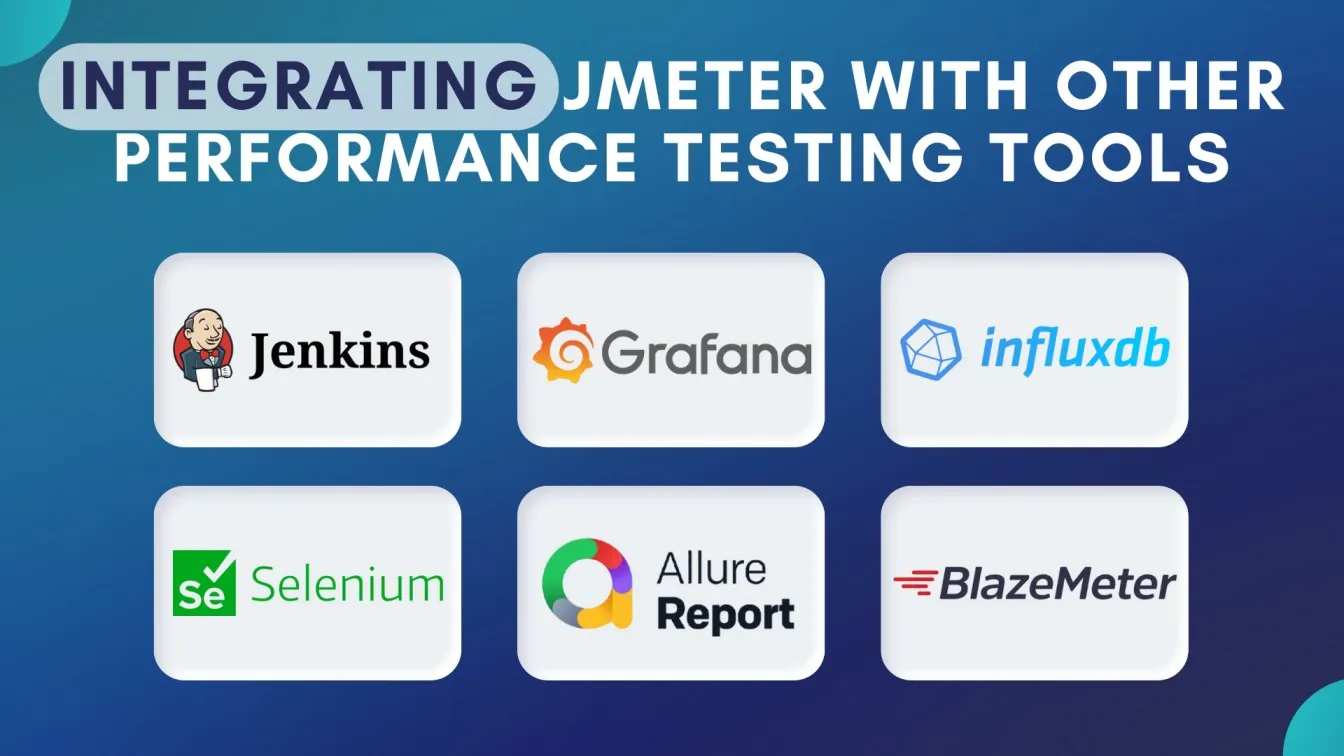
- Integration with Jenkins:
- Set up JMeter with Jenkins to automate performance testing within your CI/CD pipelines.
- Add JMeter test plans as build steps and generate automated performance reports after each deployment.
- Using Grafana and InfluxDB:
- Configure JMeter to send test results to InfluxDB and visualize real-time performance metrics in Grafana dashboards.
- This integration provides dynamic insights for monitoring server behavior under load.
- Combining with Selenium:
- Merge JMeter and Selenium to test performance alongside UI functionality.
- Use Selenium for UI testing and JMeter to simulate API or backend load.
- Leverage Allure for Reporting:
- Generate rich, interactive performance test reports by integrating JMeter results with Allure Report.
- Integrating with Cloud Testing Platforms:
- Use tools like BlazeMeter to run and scale JMeter tests in the cloud, ensuring higher scalability and accessibility.
JMeter’s flexibility and seamless integration with tools like Jenkins make it ideal for agile development environments, where continuous testing is essential.
Best Practices for Conducting Performance Testing with JMeter
The essential best practices for optimizing your JMeter performance testing process to deliver reliable, real-world results efficiently:
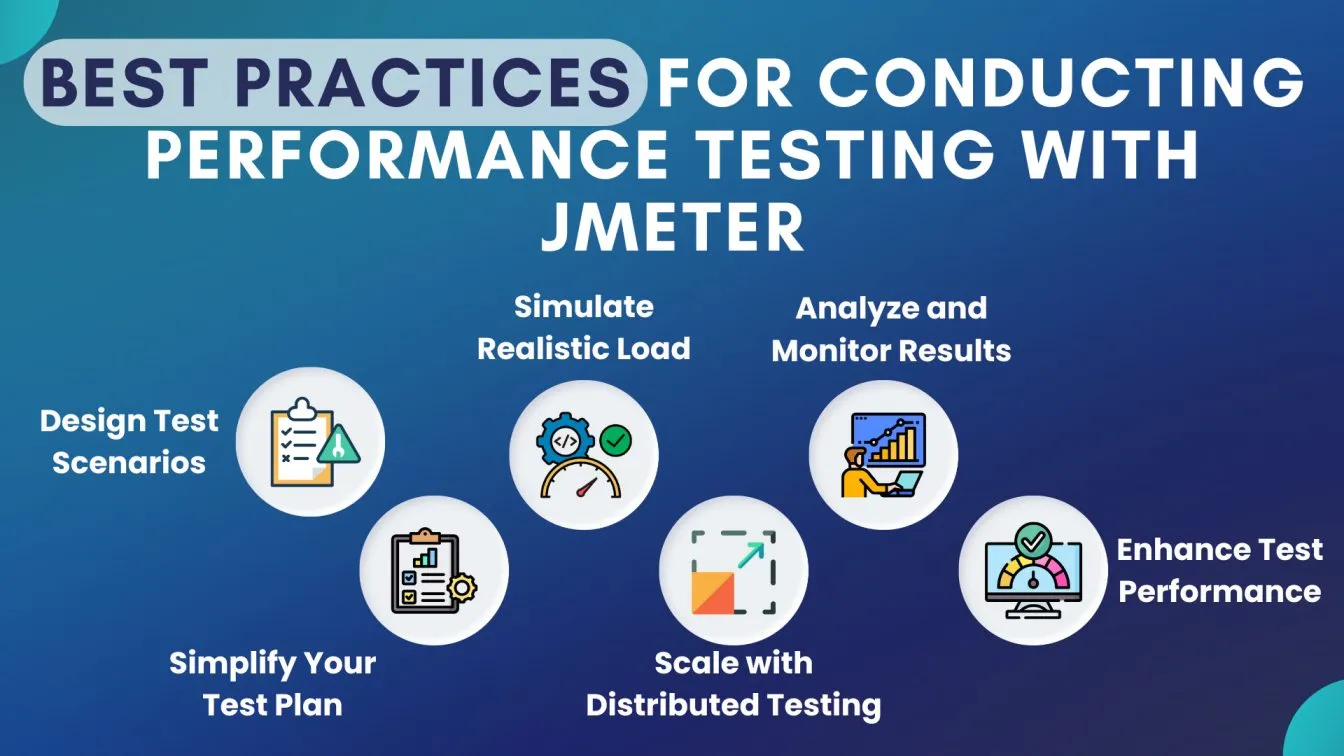
- Plan Your Test Scenarios:
- Define clear objectives and scenarios before testing.
- Identify the key metrics like response time, throughput, and error rate to focus on.
- Keep Your Test Plan Clean:
- Avoid unnecessary elements like multiple listeners in your test plan.
- Use lightweight listeners such as Simple Data Writer for large-scale tests.
- Simulate Real-World Load:
- Use Timers to add think times between requests to mimic real user behavior.
- Parameterize input data using the CSV Data Set Config to simulate dynamic scenarios.
- Use Distributed Testing for Scalability:
- Run tests on multiple machines to simulate high user loads effectively.
- Configure JMeter’s master-slave setup for distributed testing.
- Monitor and Analyze Results Thoroughly:
- For real-time monitoring, use the integrations between Grafana and InfluxDB.
- To find bottlenecks, examine measures like error rates and 90th percentile response times.
- Optimize for Better Performance:
- Optimize the test script and server configuration to avoid skewed results.
- Run baseline tests to set benchmarks for comparison.
By following these best practices, you can achieve more reliable and actionable insights with JMeter performance testing.
Understanding the Different Types of Performance Testing with JMeter
To make sure your application can withstand varying user activity levels without sacrificing speed or stability, performance testing is crucial. Apache JMeter is a flexible tool that enables you to run different kinds of performance tests to assess how your system behaves in various scenarios. Let's examine the main categories of performance testing that JMeter allows:

- Load Testing:
- Measure how your application performs under normal user load.
- Use JMeter’s Thread Groups to simulate concurrent users and identify bottlenecks.
- Stress Testing:
- Push your system beyond its limits to identify its breaking point.
- Gradually increase user loads in JMeter to observe system failures and recovery.
- Endurance Testing:
- Evaluate system behavior under prolonged usage.
- Utilize JMeter’s looping feature to simulate extended periods of activity.
- Spike Testing:
- Test how your application handles sudden traffic surges.
- JMeter can generate rapid traffic spikes to check stability and response.
- Scalability Testing:
- Analyze how the system performs as resources or user loads increase.
- Use JMeter’s distributed testing for large-scale simulations.
Load and stress testing are crucial for detailed testing of web application performance.
Common Challenges in JMeter Performance Testing and How to Overcome Them
Although it has drawbacks, performance testing with Apache JMeter is a potent technique to make sure your apps live up to user expectations. These challenges, which range from handling complicated scripts to managing system resources, may affect the outcomes of your tests. Let's examine the most frequent problems testers encounter and effective solutions.
- High Resource Usage:
- Issue: Running large tests can overload your system.
- Solution: Use non-GUI mode or distributed testing to balance the load.
- Inconsistent Results:
- Issue: Test results can vary due to network instability or misconfigurations.
- Solution: Run tests in a controlled environment with multiple iterations for accurate data.
- Handling Dynamic Data:
- Issue: APIs with dynamic tokens or session IDs can cause test failures.
- Solution: Use Regular Expression Extractors to capture and reuse dynamic values.
- Script Maintenance:
- Issue: Complex test scripts can become difficult to manage.
- Solution: Create modular test plans and use parameterization for reusability.
- Result Analysis:
- Issue: Large test data can be hard to interpret.
- Solution: Integrate tools like Grafana for better visualization and insights.
Left testing, or testing early in the development cycle, can prevent negatives in tests and save significant time and resources. Identifying negatives in tests, such as excessive resource consumption or incorrect configurations, is crucial for accurate performance evaluations. Running JMeter in non-GUI mode is a practical solution for time, as it reduces resource consumption during extensive tests.
Optimizing JMeter for Large-Scale Performance Tests
To guarantee precise and effective results, Apache JMeter must be optimized for extensive performance tests. Follow these best practices:
- To operate in non-GUI mode: To save system resources, run JMeter in command-line mode. Apply the following command: jmeter -n -t testplan.jmx -l results.jtl.
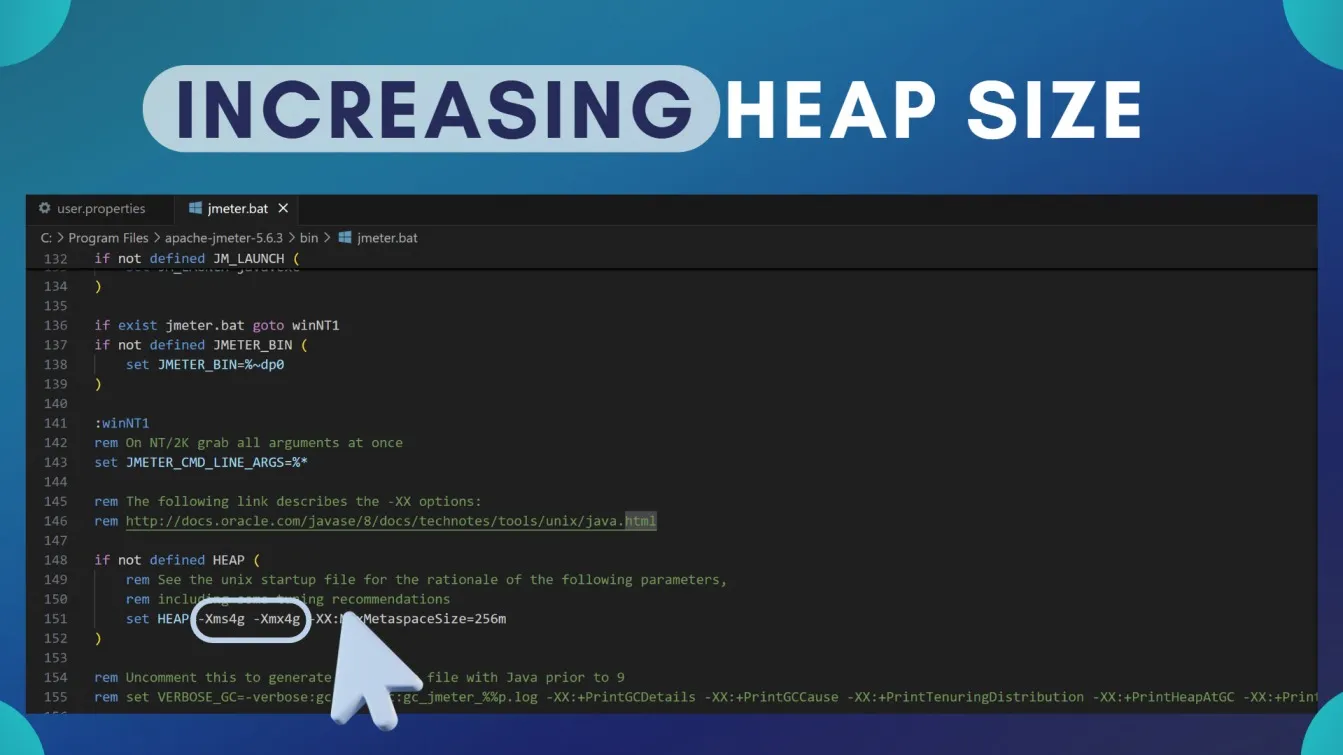
- Increase JVM Heap Size: Change the jmeter.bat or jmeter.sh file to give JMeter more memory. Use the parameters -Xms2g -Xmx2g to set the heap size.
- Use Distributed Testing: Distribute the load across multiple machines to simulate a higher number of users. Configure JMeter's master-slave setup for this purpose.
- Limit Listeners: Avoid using GUI listeners during tests, as they consume significant resources. Instead, write results to a file and analyze them post-test.
- Optimize Thread Groups: Design thread groups to mirror real-world usage patterns, adjusting the number of threads, ramp-up periods, and loop counts accordingly.
Implementing these strategies will enhance JMeter's performance during large-scale testing scenarios.
Future Trends in JMeter Performance Testing: What to Expect
Performance testing is always changing, and Apache JMeter keeps up with emerging technologies and challenges. JMeter is poised to be a key component in satisfying the demands of enterprises for applications that are faster and more scalable. The following major themes will influence JMeter performance testing going forward:

- Connectivity to CI/CD Pipelines:
- For automated performance testing in processes involving continuous integration and deployment, JMeter is quickly becoming a common solution.
- Cloud-Based Testing:
- Cloud platforms are enabling JMeter to execute large-scale tests without requiring extensive local resources, improving scalability.
- Real-Time Monitoring:
- Enhanced integrations with tools like Grafana offer live performance insights for faster decision-making during tests.
- Focus on APIs and Microservices:
- Modern architectures are dominated by microservices and APIs, and JMeter is developing to effectively test these.
- AI-Powered Improvements:
- Performance testing with JMeter is becoming easier with the application of AI in test script design, execution, and result analysis.
The application of engineering principles like AI-driven optimization is revolutionizing performance testing. Embracing these trends will ensure your performance testing processes remain cutting-edge and effective.
Wrapping up!
Ensuring seamless user experiences across complex applications requires reliable performance testing tools. JMeter, a powerful tool for API load testing, plays a crucial role in evaluating applications under various load conditions. By using its Graphical User Interface, testers can simulate dynamic resources like subsequent requests and track metrics such as average response time and response codes.
With Logic Controllers, Transaction Controllers, and configurations like Thread Properties, JMeter adapts to types of applications and types of requests seamlessly. Its enhanced testing flexibility supports protocol-level load tests and simple load tests, making it a go-to tool for security testing, functional behavior analysis, and continuous testing.
From creating robust load test plans to seamless integration with CI/CD pipelines, JMeter empowers teams to handle critical sites and achieve efficient application programming interface testing. With emerging trends like real browser simulations, cloud scalability, and AI-driven optimization, JMeter ensures your testing remains future-ready. Following this guide, you’re well-equipped to optimize complex test scenarios and deliver exceptional software quality in any environment.
People Also Ask
👉What is the main purpose of JMeter?
JMeter is a performance testing tool for simulating user behavior patterns under load conditions. It supports API performance testing, Stress Tests, and other forms of performance testing, offering comprehensive testing for protocols like HTTP and FTP servers.
👉Is JMeter similar to Selenium?
No. JMeter is for performance testing, focusing on simulated load and API tests, while Selenium handles functional testing in real browsers. Together, they can provide holistic API testing.
👉What is the difference between JMeter and Postman?
Postman excels in functional testing of APIs, focusing on request samplers and configurations. JMeter, as a performance testing tool, evaluates simulated load, stress testing, and additional metrics.
👉What is JMeter performance testing?
It involves simulating genuine user behavior to test an application’s actual performance under load using features like load injector servers, User Defined Variables, and continuous performance testing.
👉What are the disadvantages of JMeter?
JMeter lacks real browser interaction, making some tests less realistic. It can be time-consuming for complex scenarios and may require additional tools like Azure Load Testing for comprehensive API performance testing.




%201.webp)

