
Apache JMeter is a powerful open-source tool for performance testing, load testing, and API testing. Known for its user-friendly interface, wide protocol support, and scalability, JMeter is a go-to solution for testers.
This blog covers the Top 50 JMeter Interview Questions across Beginner, Intermediate, and Advanced levels, helping you master key concepts like thread groups, samplers, controllers, distributed testing, and more.
Whether you're preparing for an interview or boosting your JMeter skills, this guide has you covered. Let’s dive in!
What Contents to Explore in This Blog?
📌 Key JMeter interview questions are categorized into Beginner, Intermediate, and Advanced levels.
📌 Techniques for handling types of requests and managing dynamic resources in test plans.
📌 Insights into configuration elements, pre-processors, and response assertion.
📌 Strategies for effective security testing, load testing, and performance measurement.
📌 Best practices for testing under different environments, ensuring compliance with business requirements.
Beginner Level - Jmeter Interview Questions
Performance testing is a critical aspect of software development to ensure that applications can handle real-world usage scenarios efficiently. Apache JMeter, a powerful and widely-used tool, plays a vital role in this process. Below are some common beginner-level interview questions to help you understand the basics of JMeter and its capabilities.
What is Apache JMeter, and Why is It Used?
Apache JMeter is an open-source tool for load and performance testing. It supports multiple protocols like HTTP, FTP, JDBC, and SOAP/REST APIs. JMeter is used to simulate real user traffic, measure application performance under load, identify bottlenecks, and ensure scalability, stability, and reliability of web applications and services.
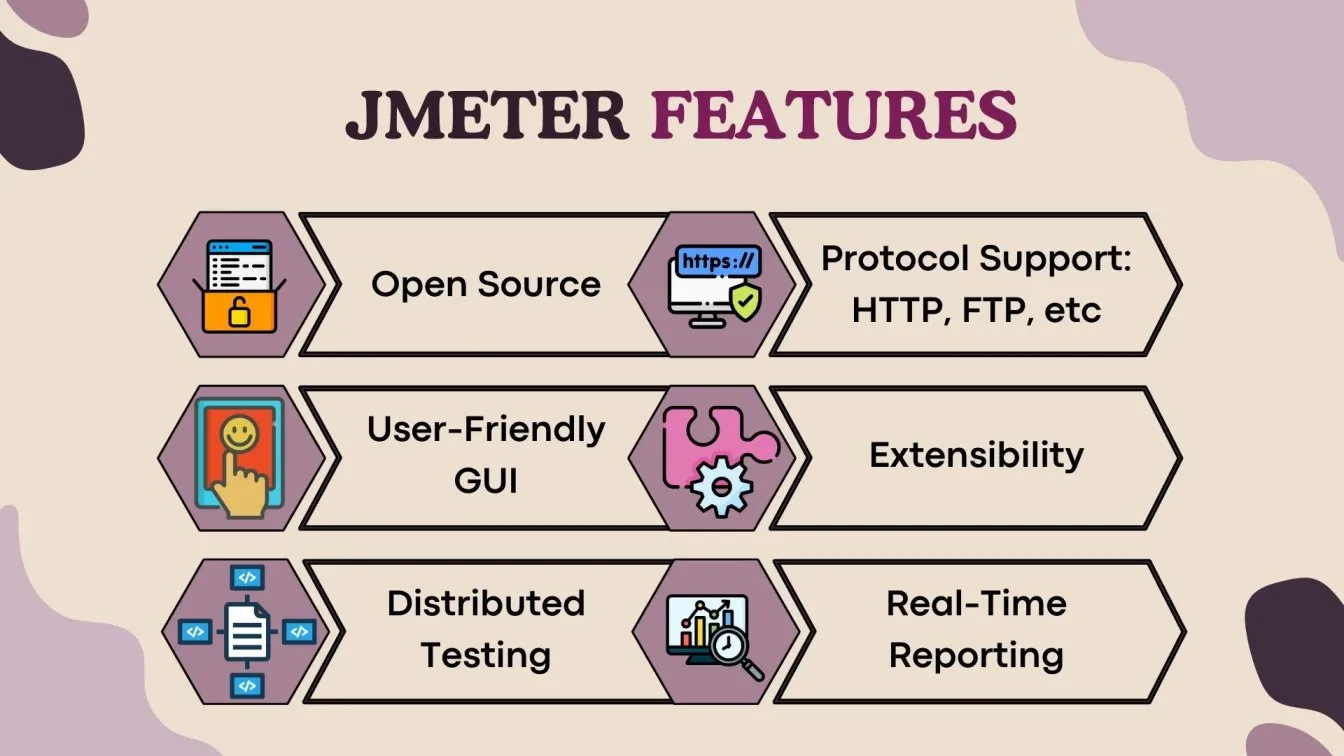
List the key features of JMeter.
- Open Source: Free and community-driven.
- Protocol Support: HTTP, FTP, JDBC, SOAP, REST, etc.
- User-Friendly GUI: simplifies test creation.
- Extensibility: Supports plugins and custom scripts.
- Distributed Testing: Handles large-scale testing.
- Real-Time Reporting: Detailed insights and metrics.
What is a Test Plan in JMeter?
A test plan is the backbone of the JMeter test, defining the test flow. It includes components like thread groups, samplers, timers, assertions, and listeners, outlining the configuration for the performance test.
Explain the purpose of a thread group.
A thread group defines the user load for a test. It specifies the number of virtual users (threads), the ramp-up period, and the loop count, controlling the test execution flow. It’s the foundation of any JMeter test.
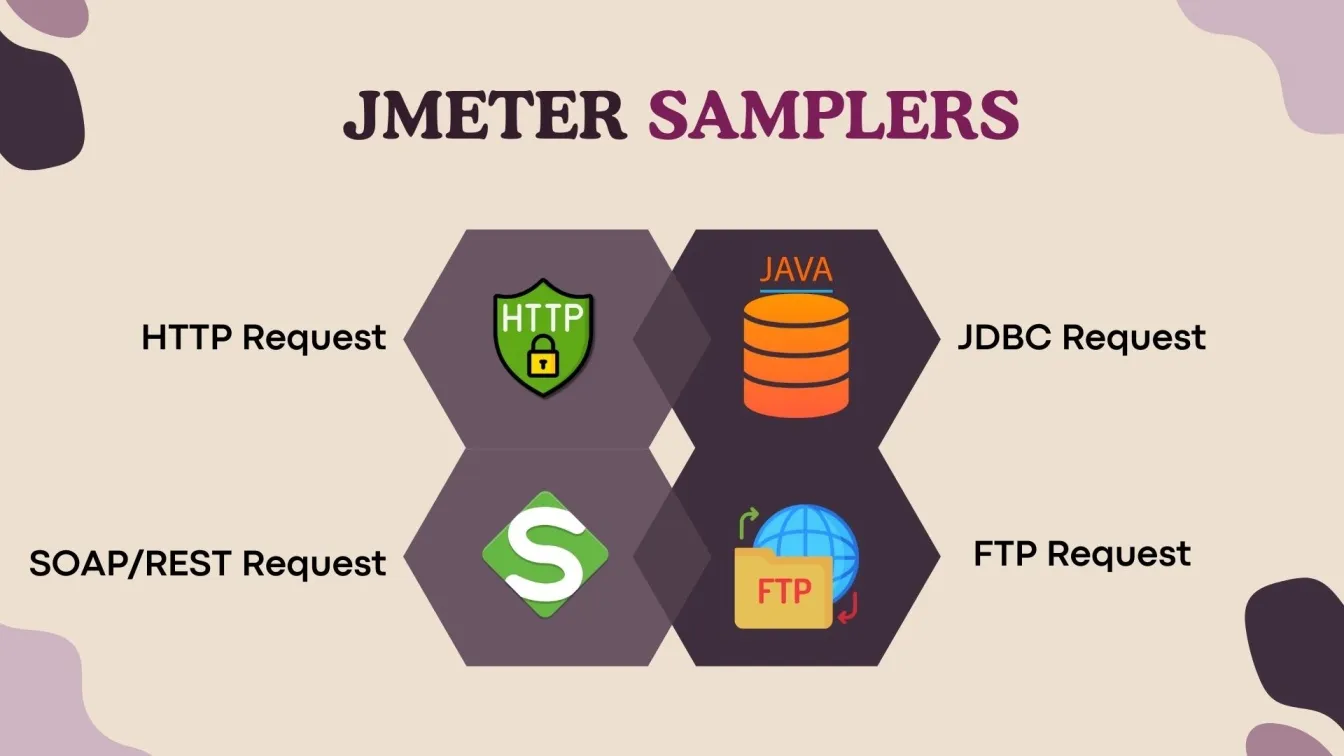
What are samplers in JMeter? Name a Few Commonly Used Samplers
Samplers in JMeter send requests to servers and receive responses, simulating user interactions. Common samplers include HTTP Request for web apps, JDBC Request for database queries, SOAP/REST Request for APIs, and FTP Request for file transfers. These samplers enable testing across different protocols and scenarios.
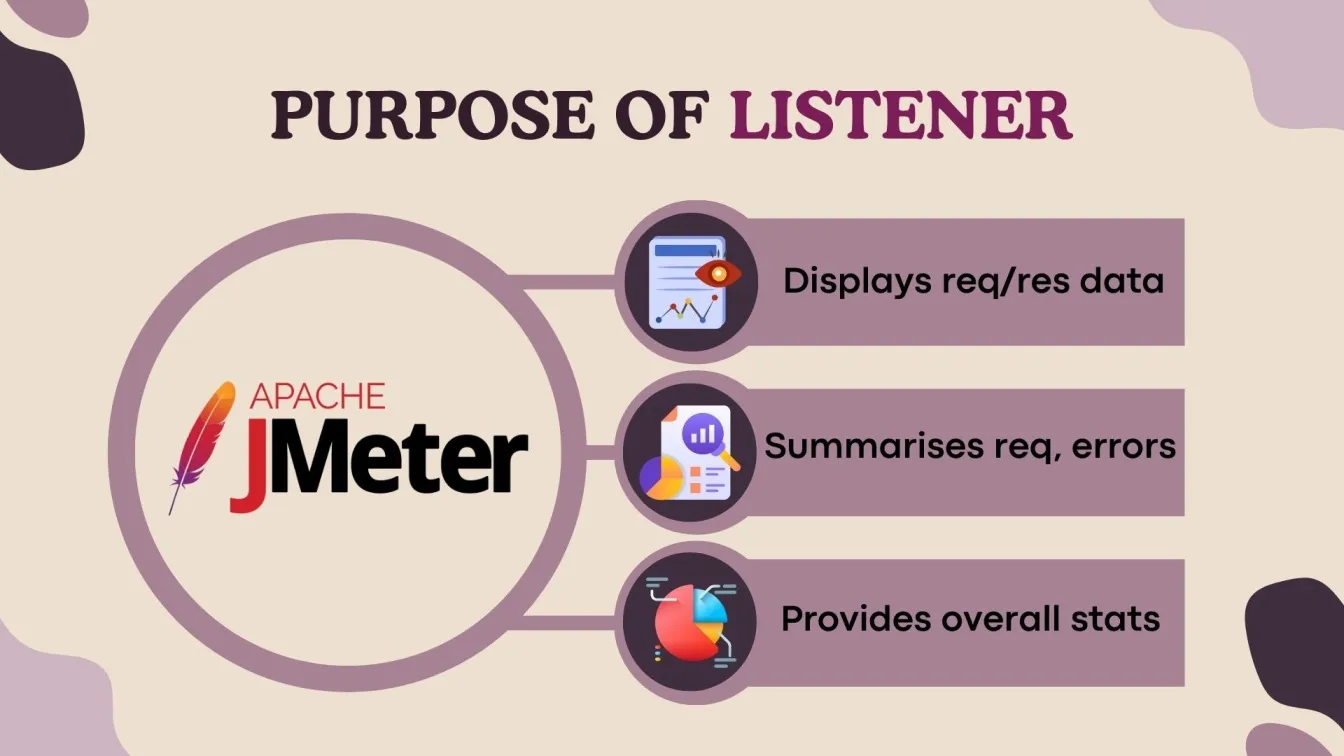
What is a listener in JMeter, and What Is Its Purpose?
A Listener in JMeter collects and displays test results, showing metrics like response time, throughput, and error rates. Common types include the View Results Tree for detailed data, the Summary Report for overall metrics, and the Aggregate Report for performance stats. These listeners are crucial for analyzing test performance.
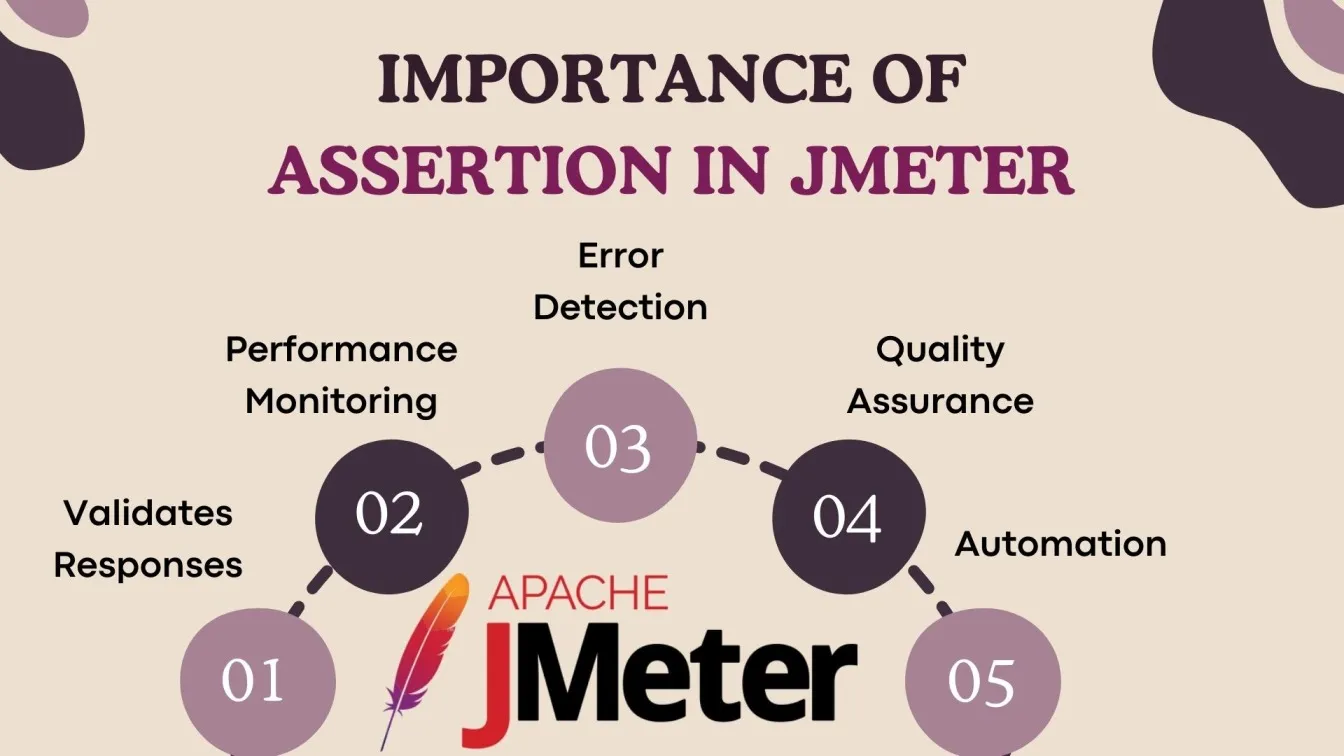
What is an assertion in JMeter, and Why Is It Important?
An assertion validates server responses during a test. It ensures that the output meets expectations (e.g., the response contains specific text or matches HTTP status). Assertions help identify functional issues and ensure test accuracy.
Explain the Ramp-Up Period in a Thread Group
The ramp-up period in a thread group determines how long JMeter takes to start all threads gradually. For example, with 10 threads and a 20-second ramp-up, one thread starts every 2 seconds. It ensures a smooth load increase, preventing sudden server overload.
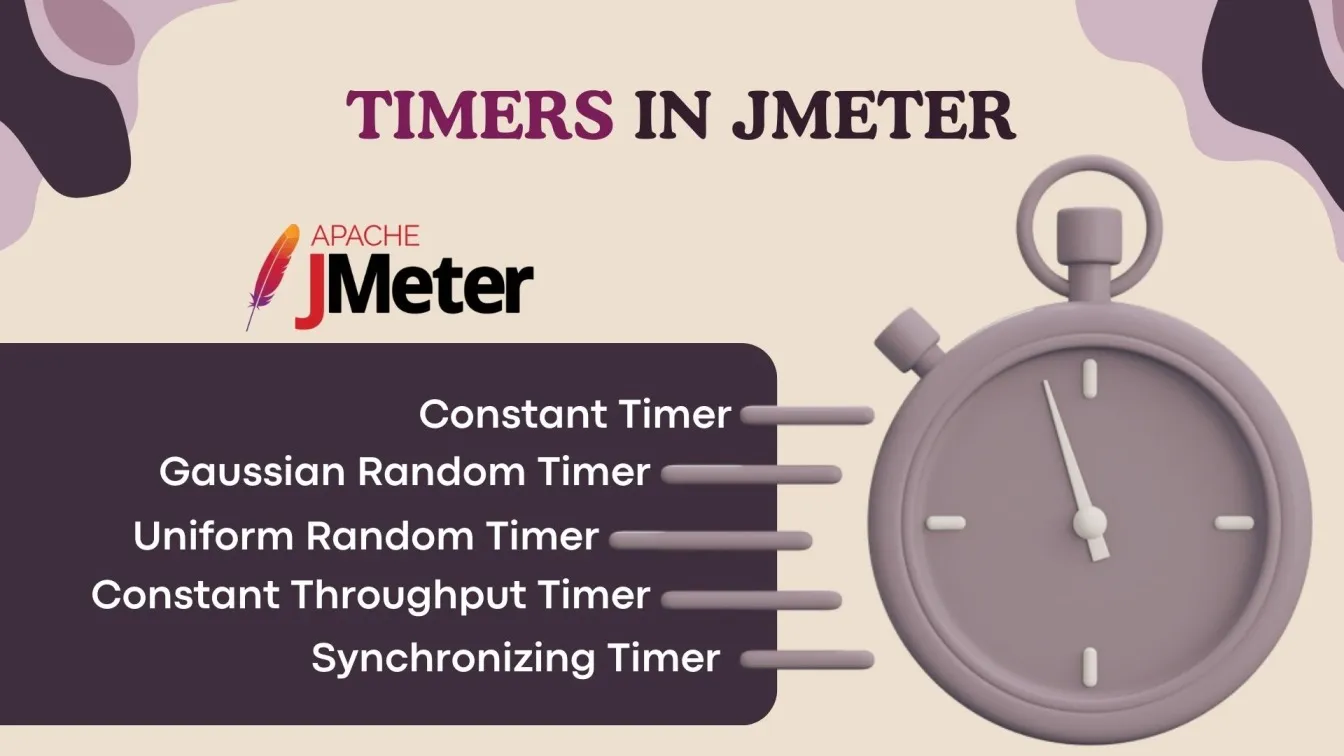
What is a Timer in JMeter, and When Do You Use It?
Timers in JMeter add delays between requests to simulate real-world user behavior and control test pacing. They mimic network latency or random delays, ensuring realistic interactions and preventing artificial traffic spikes during testing.
How Do You Parameterize a Test in JMeter?
Parameterization in JMeter replaces hardcoded values with dynamic data using CSV Data Set Config or User-Defined Variables. This allows testing with different inputs, simulating real user behavior, and running tests across multiple data sets without modifying the script.
What Is the Role of Loop Count in JMeter Testing?
Loop Count in JMeter determines how many times each thread (user) will repeat the test scenario. It is crucial for simulating repeated user actions during a test. For example, if you set a Loop Count of 3, each thread will execute the test plan three times. This helps in assessing the performance of your system under repetitive user actions, allowing you to test consistency and stress the application over multiple cycles.
How Do You Use the HTTP Request Sampler?
The HTTP Request Sampler is used to test web applications by simulating HTTP/HTTPS requests. To configure it:
- Server Name or IP: Specify the domain or IP address of the server being tested.
- Request Method (GET, POST, etc.): Choose the HTTP method for the request (e.g., GET to retrieve data, POST to submit data).
- Path (URL Endpoint): Define the URL endpoint (e.g., /login, /api/users)
- Parameters (Key-Value Pairs): Include any necessary parameters like form data or query parameters (e.g., username=admin&password=12345)
What Is the CSV Data Set Config Element Used For?
The CSV Data Set Config reads external data (e.g., usernames, passwords) from a CSV file for parameterization. It ensures dynamic, unique input for each thread, simulating real-world scenarios.
How Can You Record a Test Script Using JMeter?
To record a test script in JMeter, add the HTTP(S) Test Script Recorder under the Test Plan and set your browser’s proxy to JMeter’s default port (8888). Start the recorder and interact with the application, allowing JMeter to capture requests as HTTP samplers. Save and customize the script as needed, enabling JMeter to automatically generate test scripts based on your actions.
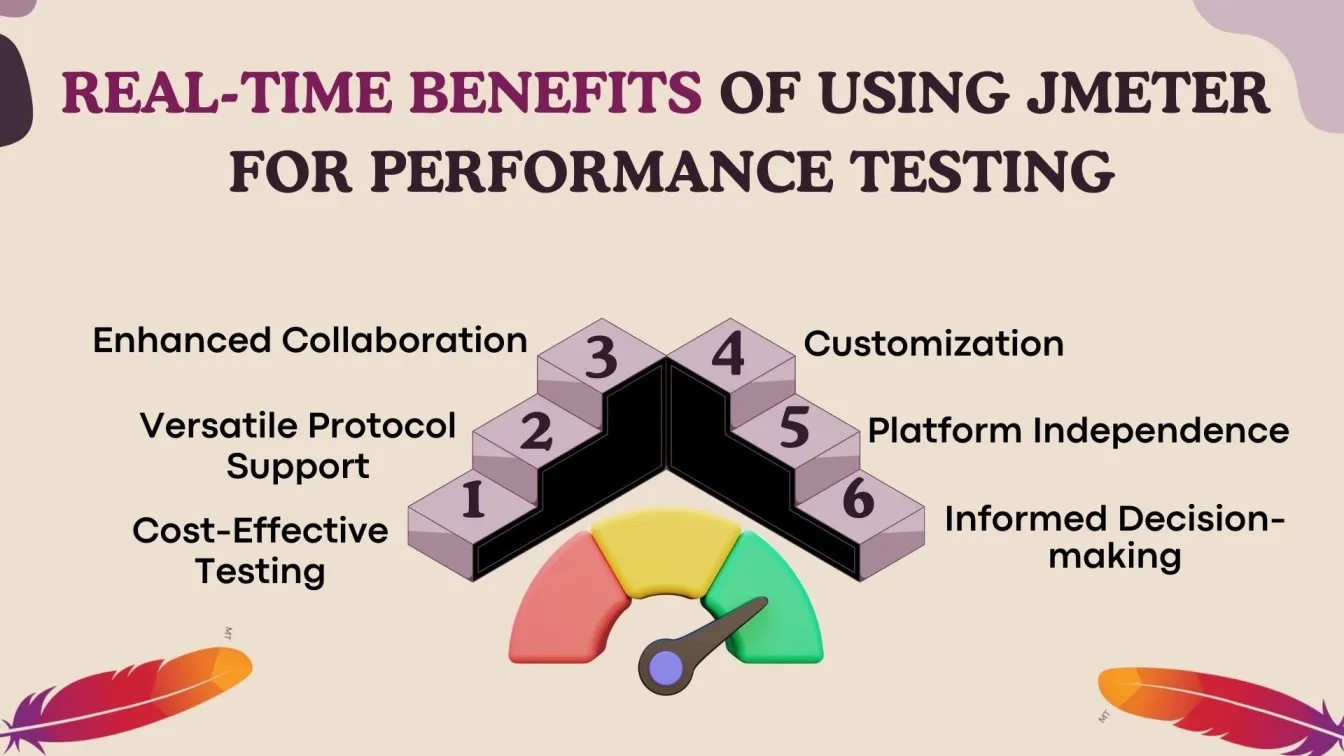
What Are the Benefits of Using JMeter for Performance Testing?
Cost-Effective Testing: As an open-source tool, JMeter is completely free to use, reducing the overall testing costs.
Versatile Protocol Support: Its ability to test multiple protocols like HTTP, FTP, JDBC, SOAP, and REST makes it adaptable for various application types.
Enhanced Collaboration: Distributed testing allows teams to work together across multiple machines for large-scale testing scenarios.
Customizability: Advanced users can extend JMeter's functionality with plugins or by creating custom scripts using Groovy or BeanShell.
Platform Independence: Being compatible with Windows, Linux, and macOS ensures flexibility across different environments.
Informed Decision-Making: Visual reports with real-time metrics empower teams to analyze performance bottlenecks and optimize infrastructure confidently.
Intermediate Level - Jmeter Interview Questions
As you dive deeper into JMeter, understanding its core components is crucial for effectively designing test plans. Below are some key interview questions that highlight JMeter’s essential concepts, advanced functionalities, and real-world applications.
Explain the Different Types of Controllers in JMeter
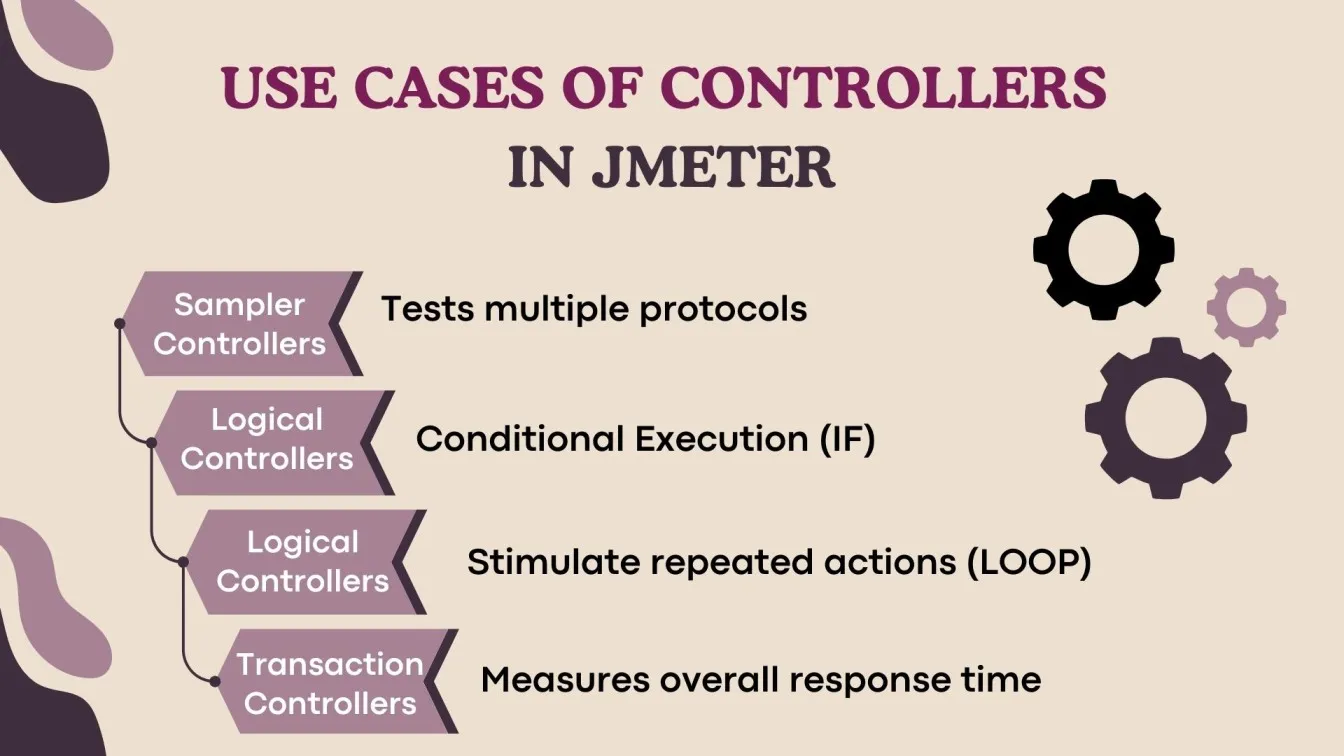
JMeter controllers manage request execution. Sampler Controllers send requests, like the HTTP Request Sampler, for testing page load times. Logical controllers control flow, such as the If controller for conditional requests and the Loop controller to repeat requests for load testing. The Transaction Controller groups request to measure combined performance, like tracking response times for actions such as login and checkout.
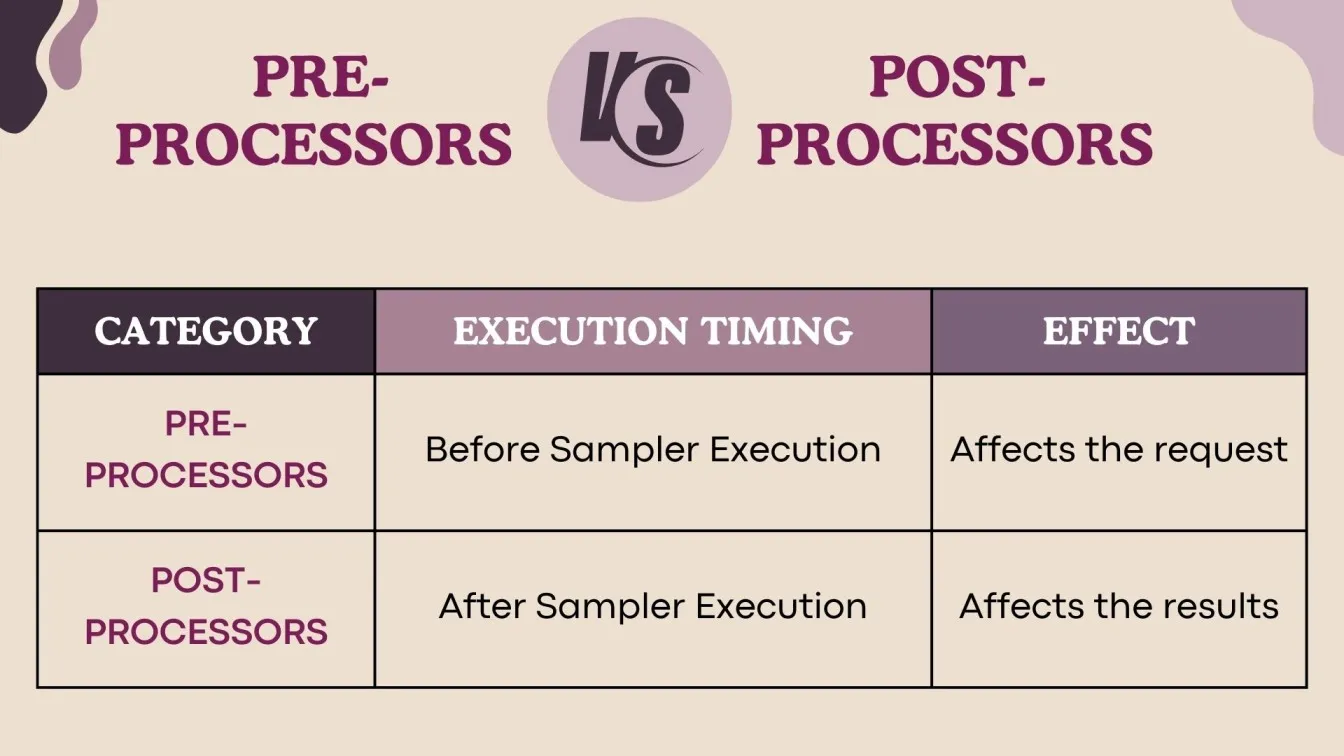
What Is the Purpose of Pre-Processors and Post-Processors? Provide Examples
Pre-Processors: Modify requests before execution.
Example: HTTP URL Rewriting Modifier adds session info to URLs.
Post-Processors: Extract data after responses.
Example: Regular Expression Extractor captures dynamic values like tokens.
How Do You Handle Dynamic Values Using the Regular Expression Extractor?
Use the Regular Expression Extractor to capture dynamic response values (e.g., session IDs, tokens):
- Add it under the sampler.
- Define a Regex Pattern (e.g., "token=(.*?)").
- Reference it using ${variable_name} in subsequent requests.
What Is Correlation in JMeter, and How Is It Implemented?
Correlation in JMeter captures and reuses dynamic data like session tokens or IDs from server responses. It is implemented using extractors (e.g., Regular Expression Extractor) to capture values and reference them in later requests with variables (e.g., ${sessionID}). This ensures realistic and continuous test execution.
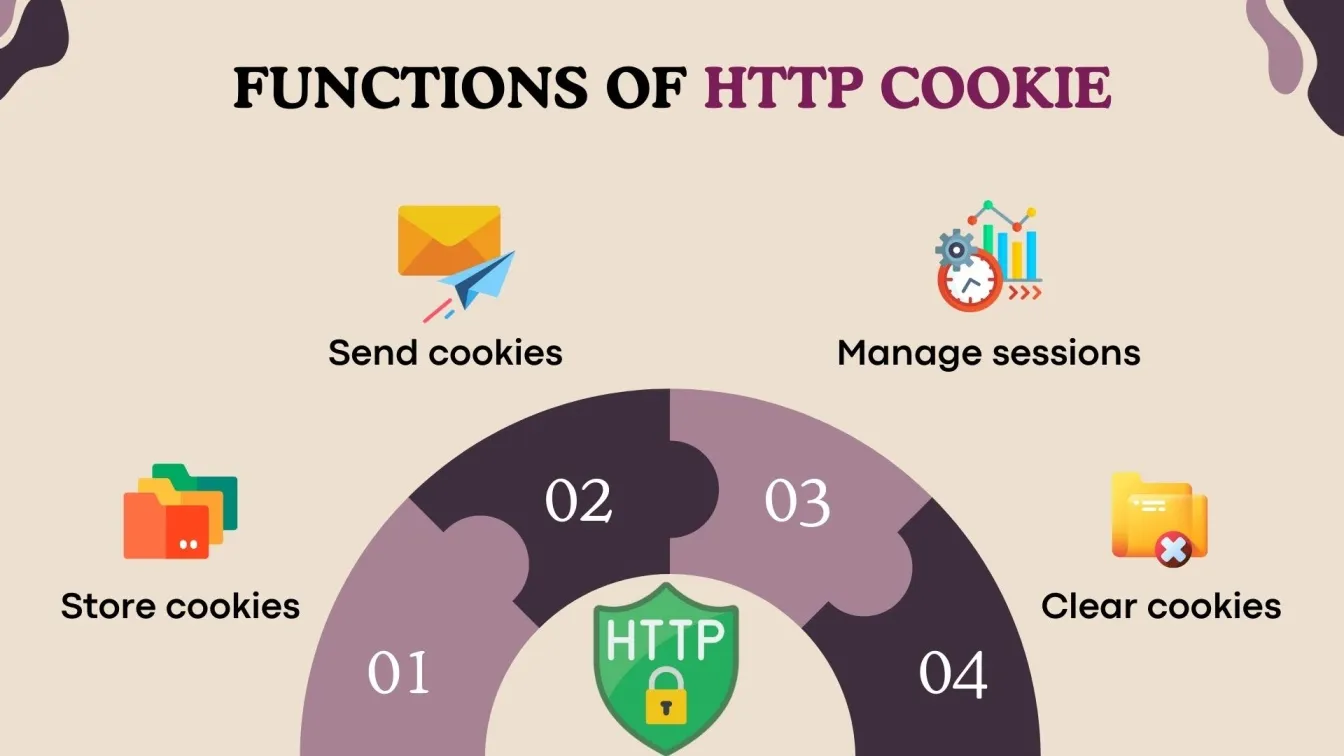
What Is the Function of the HTTP Cookie Manager?
The HTTP Cookie Manager manages cookies automatically, mimicking browser behavior. It stores cookies sent by the server and includes them in subsequent requests, ensuring proper session handling.
How Do You Monitor Server Performance During a JMeter Test?
Use JMeter Plugins (e.g., PerfMon) or external tools like New Relic or AppDynamics to track server metrics (CPU, memory, disk I/O). JMeter itself focuses on client-side metrics.
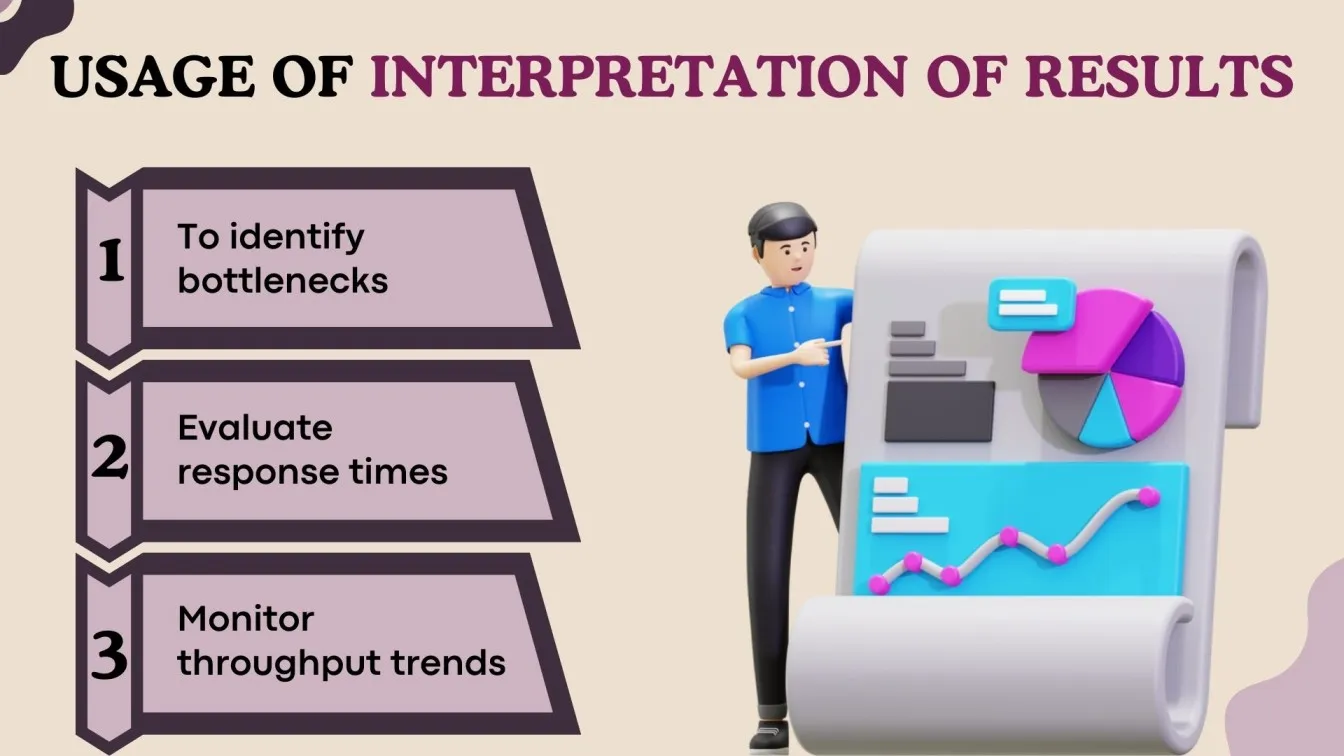
What Is the Aggregate Report Listener, and How Do You Interpret Its Results?
The Aggregate Report Listener in JMeter provides a summary of test results, offering key metrics like Label (request name), Samples (total requests), Average (average response time), 90% Line (max response time for 90% of requests), and Throughput (requests per second). These metrics help identify bottlenecks, evaluate response times, and track throughput trends, ensuring that performance meets requirements.
How Can You Test APIs or Web Services with JMeter?
To test APIs or web services with JMeter:
- Configure HTTP Request Sampler: Set the API endpoint, HTTP method (GET, POST, etc.), headers, and parameters.
- Add Assertions: Validate response codes and data (e.g., using JSON Path or XPath).
- Use Dynamic Input: Leverage CSV Data Set Config for parameterization.
- Analyze Results: Use listeners like Summary Report to review performance metrics.
What Is the Purpose of the Debug Sampler in JMeter?
The Debug Sampler in JMeter is used during test development for troubleshooting. It helps validate variable extraction, configurations, and request-response accuracy. It displays variable values (like session data), JMeter properties (runtime settings), and request/response details, ensuring proper data flow and configuration.
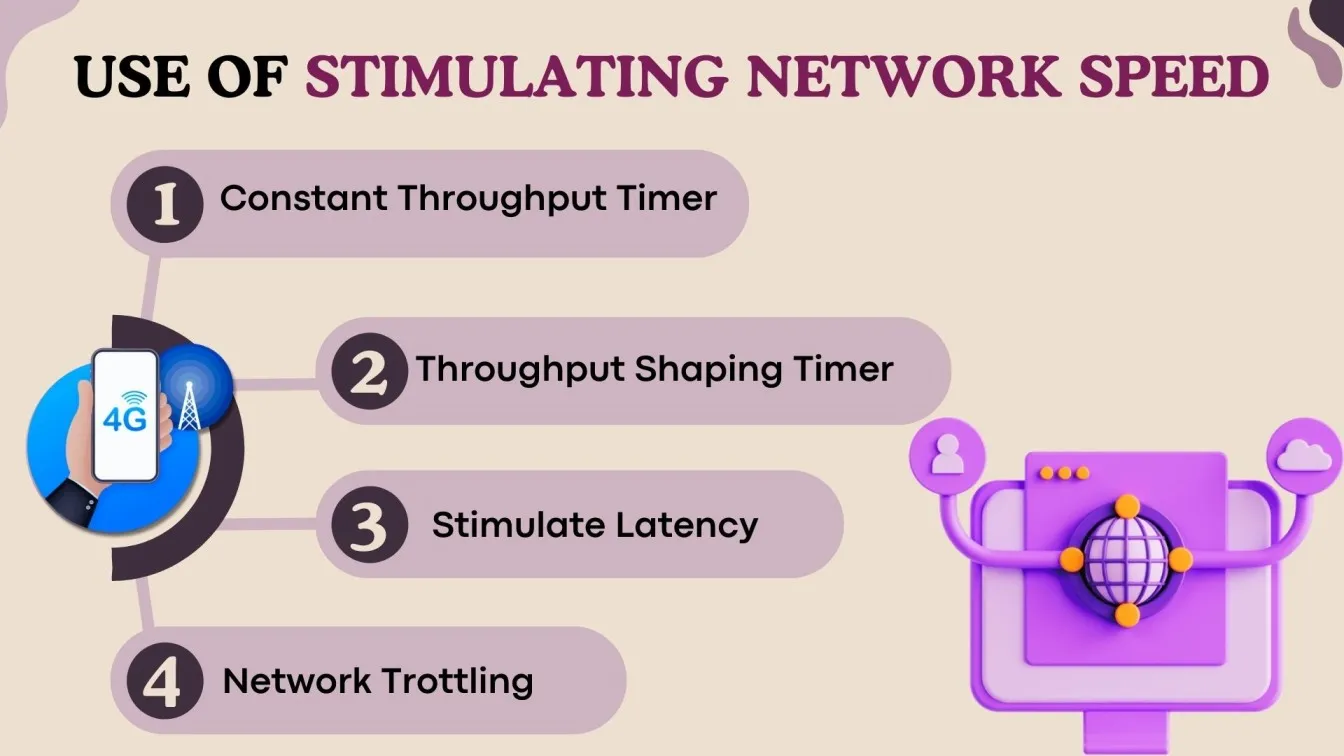
How Can You Simulate Different Network Speeds in JMeter?
Use the Throttle Bandwidth feature in the HTTP(S) Test Script Recorder or the Bandwidth Throttling plugin to mimic slower network conditions like 3G or 4G speeds.
What Is the Purpose of the Backend Listener in JMeter?
The Backend Listener sends real-time test metrics (e.g., throughput, response time) to external monitoring systems like InfluxDB, Prometheus, or Graphite for advanced analysis and visualization.

Explain How JMeter Handles Sessions and Cookies During a Test
JMeter handles sessions by capturing dynamic session data, such as session IDs or authentication tokens, from server responses. This data is extracted using components like the Regular Expression Extractor or JSON Extractor and stored in variables. These variables are then used in subsequent requests to maintain session continuity. Additionally, JMeter can handle session-related headers, such as authorization tokens, through the HTTP Header Manager to ensure proper session management during the test.
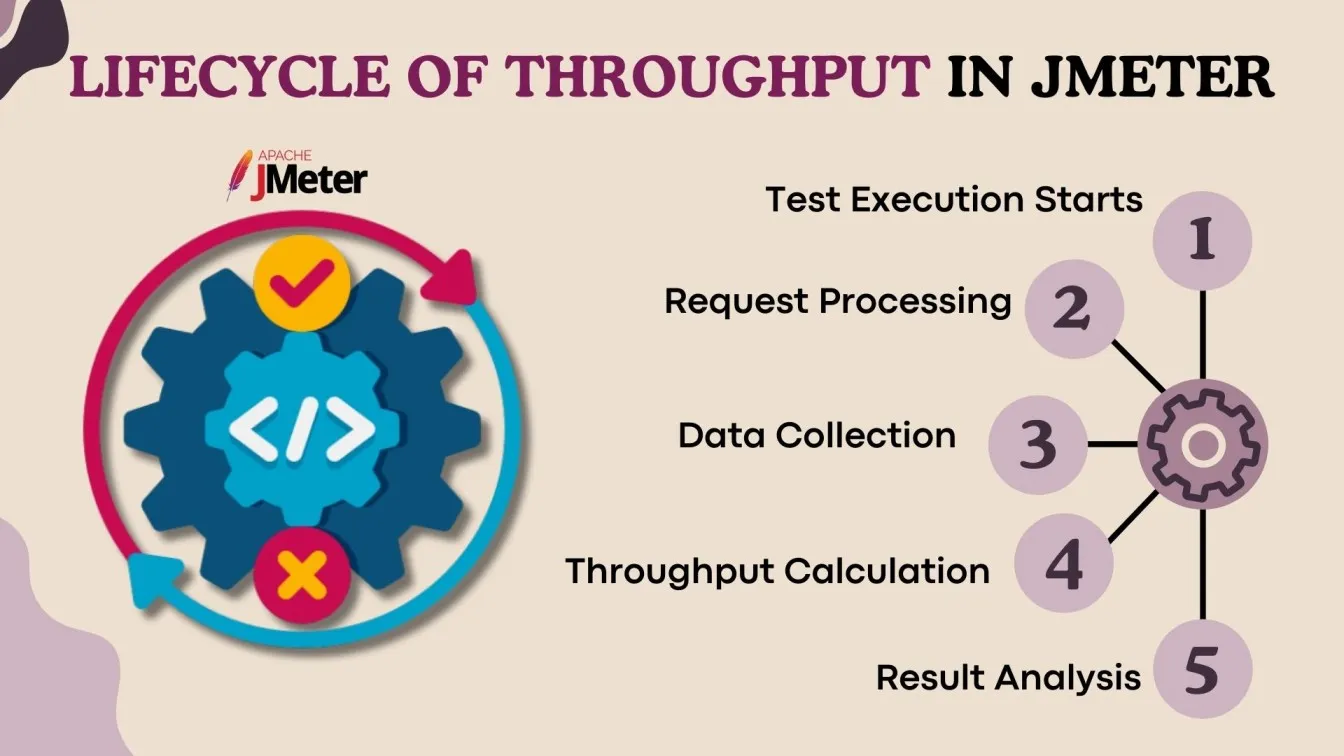
What Is Throughput, and How Is It Measured in JMeter?
Throughput measures the number of requests processed per second (or minute) by the server. In JMeter, it's displayed in the aggregate report and summary report. Higher throughput with low response time indicates better performance and system efficiency under load.
What Is the Purpose of the Response Time Graph Listener?
The Response Time Graph listener visualizes the response times of requests over time, helping identify latency trends, performance issues, and bottlenecks. It’s essential to analyze how response times fluctuate during the test.
Describe How to Integrate JMeter with Jenkins for CI/CD
To integrate JMeter with Jenkins for CI/CD, start by installing the Jenkins Performance Plugin to enable JMeter support. Next, set up a Jenkins job to execute JMeter tests in non-GUI mode using the command: jmeter -n -t test.jmx. Configure Jenkins to generate and display JMeter reports and performance metrics. Finally, automate test execution by scheduling the tests to run with each build, ensuring continuous performance validation as part of the CI/CD pipeline.
Advanced Level - Jmeter Interview Questions
For advanced performance testing, JMeter offers a wide array of features and techniques to handle complex scenarios. Interviewers may delve deeper into how JMeter can be configured for large-scale tests, complex authentication, custom scripting, and performance optimizations. Below are key questions that focus on advanced usage of JMeter.
How Do You Perform Distributed Testing with JMeter?
Distributed testing in JMeter involves running tests across multiple machines to simulate high loads. Set up a master machine and configure others as slaves. Update rmi.properties for communication, then trigger tests using the master’s Remote Start. Analyze results from all machines to evaluate performance.
Explain How to Handle Authentication in JMeter (e.g., Basic Auth, OAuth).
Basic Authentication:
- Add HTTP Authorization Manager to your test plan.
- Set the username and password for basic auth.
OAuth Authentication:
- Use OAuth 1.0/2.0 for API authentication.
- Add OAuth2 or HTTP Header Manager to pass access tokens or OAuth parameters.
- Automate token retrieval using preprocessors like OAuth2 authorization.
What Is the JSR223 Sampler, and How Is It Used?
The JSR223 Sampler in JMeter allows you to execute custom scripts (e.g., Groovy, JavaScript, BeanShell) to implement complex logic or manipulate request data before or after execution. Groovy is often preferred for its performance and simplicity. It’s commonly used for custom assertions, data manipulation, or handling dynamic values during tests.
How Do You Write Custom Scripts in JMeter Using BeanShell or Groovy?
To write custom scripts in JMeter, use BeanShell or Groovy. For BeanShell, add a BeanShell Sampler and write Java-like code to manipulate variables or add logic for dynamic data extraction or assertions. For Groovy, add a JSR223 Sampler, set the language to Groovy, and leverage its powerful features to manage variables and implement complex logic with better performance than BeanShell.
What Are Some Techniques for Optimizing JMeter Performance for Large Scale Tests?
To optimize JMeter performance for large-scale tests:
- Run in Non-GUI Mode: Use jmeter -n to reduce resource usage.
- Leverage Distributed Testing: Spread the load across multiple machines.
- Disable Heavy Listeners: Use Backend Listener for real-time reporting instead of memory-intensive Listeners.
- Optimize Test Plan: simplify components, limit assertions, and streamline data processing.
- Use JMeter Plugins: Add tools like Throughput Shaping Timer for better control and monitoring.
How Do You Conduct Stress Testing with JMeter?
To conduct stress testing with JMeter, set a high number of threads in the Thread Group to simulate heavy load and gradually increase the Ramp-Up Period. Monitor server performance with tools like PerfMon, use the Throughput Shaping Timer to vary traffic patterns, and analyze response times, error rates, and system behavior under stress.
What Are Some Challenges You Might Face During JMeter Testing, and How Do You Address Them?
Common JMeter testing challenges and solutions:
- System Overload: Large-scale tests can overwhelm local machines.
- Solution: Use distributed testing or non-GUI mode.
- Memory Issues: Large datasets cause Out of Memory errors.
- Solution: Increase JVM memory (-Xms, -Xmx); use Backend Listener.
- Realistic load: Simulating real traffic and user behavior is tough.
- Solution: Use Timers, CSV Data Set Config, optimize Thread Groups.
- Dynamic Data: Extracting values like session IDs.
- Solution: Use correlation with Regex Extractor or JSON Extractor.
Explain the Concept of Spike Testing and How to Implement It in JMeter
Spike testing involves subjecting the system to a sudden, sharp increase in load to test its response and recovery. To implement it in JMeter, use a Thread Group with a high number of threads, apply a Throughput Shaping Timer for rapid load changes, and monitor server performance. Analyze how the system handles the surge and recovers after the spike.
What Is the Purpose of the HTTP Header Manager?
The HTTP Header Manager allows you to manage and configure HTTP headers for requests. It is used to define custom headers like Content-Type, Authorization, Cookies, and User-Agent. This is crucial for testing APIs, simulating real browser requests, and handling authentication (e.g., Basic Auth) during performance testing.
How Can You Extend JMeter’s Functionality with Plugins?
JMeter's functionality can be extended using plugins via the Plugin Manager. Key plugins include listeners for reporting, samplers for additional protocols, timers for load shaping, and monitors like PerfMon for real-time monitoring. Plugins help optimize tests and provide deeper performance insights.
What Is the Significance of the BlazeMeter Plugin for JMeter?
The BlazeMeter Plugin for JMeter enables seamless integration with the BlazeMeter cloud platform for distributed testing. It allows you to run JMeter tests at scale, analyze results in real-time, and generate detailed reports. This plugin enhances JMeter’s capability for large-scale, cloud-based performance testing.
How Do You Debug Failed Transactions in JMeter?
To debug failed transactions in JMeter, first check the View Results Tree listener for detailed request and response data. Enable Debug Sampler to capture additional logs for troubleshooting. Also, use Assertions to verify expected behavior and review server logs for errors.
What Is the Difference Between the Constant Timer and the Uniform Random Timer?
The constant timer adds a fixed delay between requests, ensuring a constant wait time. In contrast, the Uniform Random Timer introduces a random delay within a specified range, providing variability in request timing to simulate more realistic user behavior.
Explain the Importance of Transaction Controllers in JMeter
Transaction controllers in JMeter group multiple requests into a single transaction to measure total response time. They provide accurate performance data for end-to-end user actions, helping identify bottlenecks in complex workflows.
How Do You Test Database Performance with JMeter?
To test database performance with JMeter, use the JDBC Request Sampler to send SQL queries to the database. Configure the JDBC Connection Configuration with database connection details and analyze response times, throughput, and errors using appropriate listeners.
How Does JMeter Ensure API Response Reliability and Accuracy?
JMeter ensures API response reliability by using Assertions to validate status codes and response content. It captures dynamic data with Extractors like Regular Expression Extractor, ensuring consistency. Timers simulate realistic user behavior, while Listeners collect performance metrics, helping identify issues and ensure accurate API performance.
How Do You Calculate the Number of Threads Required for a Performance Test?
To calculate the number of threads for a performance test, consider the desired load (number of users), test duration, and the target response time. Use the formula:
Threads = (Total users * Ramp-up time) / Test duration
Additionally, factor in server capacity and expected load distribution to determine a realistic number of threads.
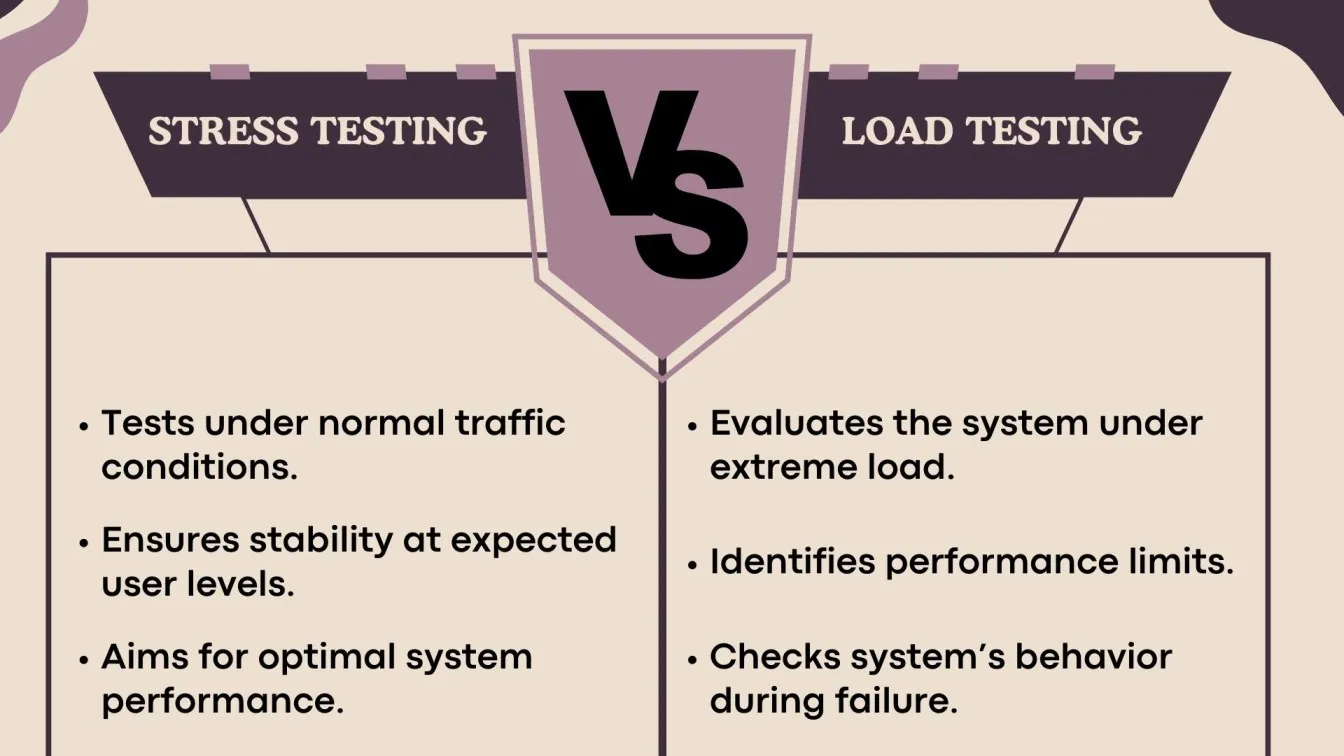
What Is the Difference Between Stress Testing and Load Testing in JMeter?
Load testing in JMeter measures a system's performance under expected user load to ensure it can handle normal traffic without issues. Stress Testing pushes the system beyond its capacity, simulating extreme conditions to identify its breaking point and observe how it handles overload or failure.
How Do You Interpret the Latency and Response Time Metrics in JMeter Reports?
Latency in JMeter measures the time it takes for a request to reach the server and return, excluding processing time. Response time includes both latency and server processing time, representing the total time for a request and response. Lower values indicate better performance, while higher values may highlight potential issues.
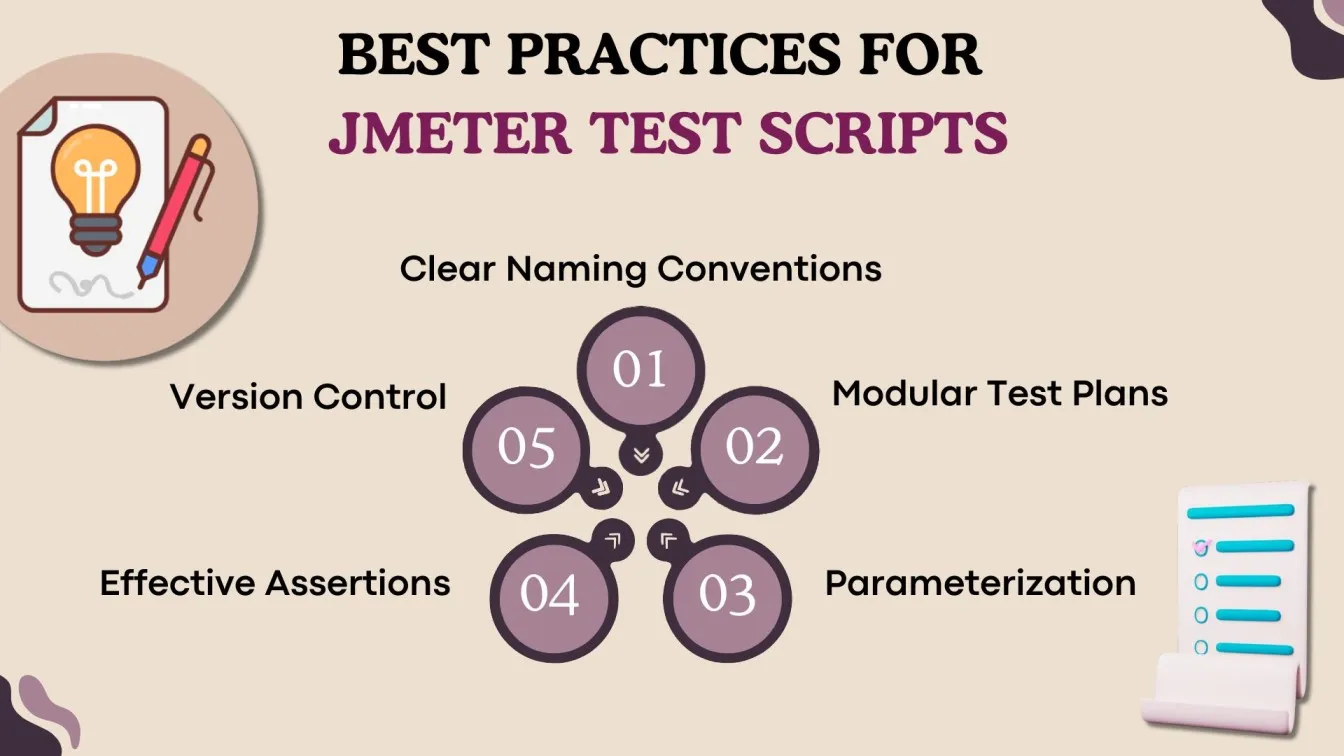
What Are the Best Practices for Creating Maintainable JMeter Test Scripts?
To create maintainable JMeter test scripts, use modular components like user-defined variables and modules. Organize tests with clear naming conventions, parameterize inputs via CSV Data Set Config, and add assertions for reliability.
Summary
This guide covers essential JMeter concepts, helping you handle different types of requests like HTTP, FTP, and SOAP while testing software and mobile applications. It explains how to measure performance with virtual users, conduct functional testing, regression testing, and non-functional testing, and ensure compliance with business requirements.
Key topics include configuration elements, response assertions, pre-processors, and managing dynamic resources for a realistic testing environment. Using JMeter’s proxy server, you can capture user requests and validate sample requests for robust security testing of any software product. Additionally, it emphasizes requirement gathering and testing under load to ensure smooth handling of user requests.
For those preparing for JMeter-related interviews, this guide provides insights into common interview questions, helping you understand both fundamental concepts and advanced techniques. Understanding JMeter’s core features and capabilities will not only help you excel in interviews but also make you proficient in real-world performance testing scenarios.
People Also Ask
👉Which scripting language is used in JMeter?
JMeter primarily uses Groovy for scripting in JSR223 components, but it also supports JavaScript and BeanShell.
👉Is JMeter difficult to learn?
JMeter is easy to learn for beginners with basic knowledge of testing and requires practice to master advanced features.
👉Does JMeter require JDK or JRE?
JMeter requires JDK to run since it uses Java-based libraries and scripting.
👉How to run JMeter without GUI?
Use the non-GUI mode by running the command: jmeter -n -t testplan.jmx -l results.jtl.
👉Which is better, JMeter or Postman?
JMeter is ideal for load testing, while Postman is better for functional API testing. The choice depends on the use case.
%201.webp)