In today’s fast-changing software world, the ability to monitor and optimize applications in real-time is crucial for maintaining a competitive edge. As organizations adopt increasingly complex software stacks, leveraging advanced technologies like Applied Intelligence has become essential. 🧠✨ New Relic, a leader in observability, offers innovative AI-powered monitoring tools that not only enhance performance but also streamline operations throughout the development lifecycle.
This blog explores New Relic’s advanced applied intelligence capabilities, providing detailed insights into how these features empower application developers to proactively address issues, automate resolutions, and optimize their performance monitoring applications. 🚀💡 For a seasoned developer or a business leader, understanding these tools will equip you to navigate the complexities of modern software environments effectively.
Key Takeaways 📋
📌 Discover how New Relic, a top observability platform, can transform your software monitoring and optimization. By using its powerful features, you’ll enhance your application’s performance and reliability. 🌟
📌 Learn how applied intelligence, powered by AI and machine learning, helps you uncover deeper insights, enabling smarter and more informed decisions in your monitoring processes. 🤖
📌 Unlock the potential of key features like anomaly detection and predictive insights, empowering you to maintain peak performance and ensure the reliability of your applications. 🔍
📌 See the benefits of faster incident response and proactive system management, creating a more efficient and resilient software environment for lasting business success. ⚙️
📌 Maximize your monitoring capabilities by seamlessly integrating New Relic with your existing software stack, achieving complete observability across all components for mission-critical outcomes. 🔗
📌 Keep up with future trends in AI and observability tools, ensuring your performance monitoring strategies are always evolving. 📈
What is New Relic?
New Relic is a leading observability platform that empowers organizations to monitor, manage, and optimize their software applications in real-time. ⏱️ In an era where entire stacks are increasingly complex, businesses need powerful tools to gain insights into application performance, user experiences, and overall system health. 📊
New Relic provides a comprehensive suite of synthetic monitoring solutions that harness applied intelligence, enabling teams to identify and address issues before they affect end users while optimizing performance proactively. 🚀
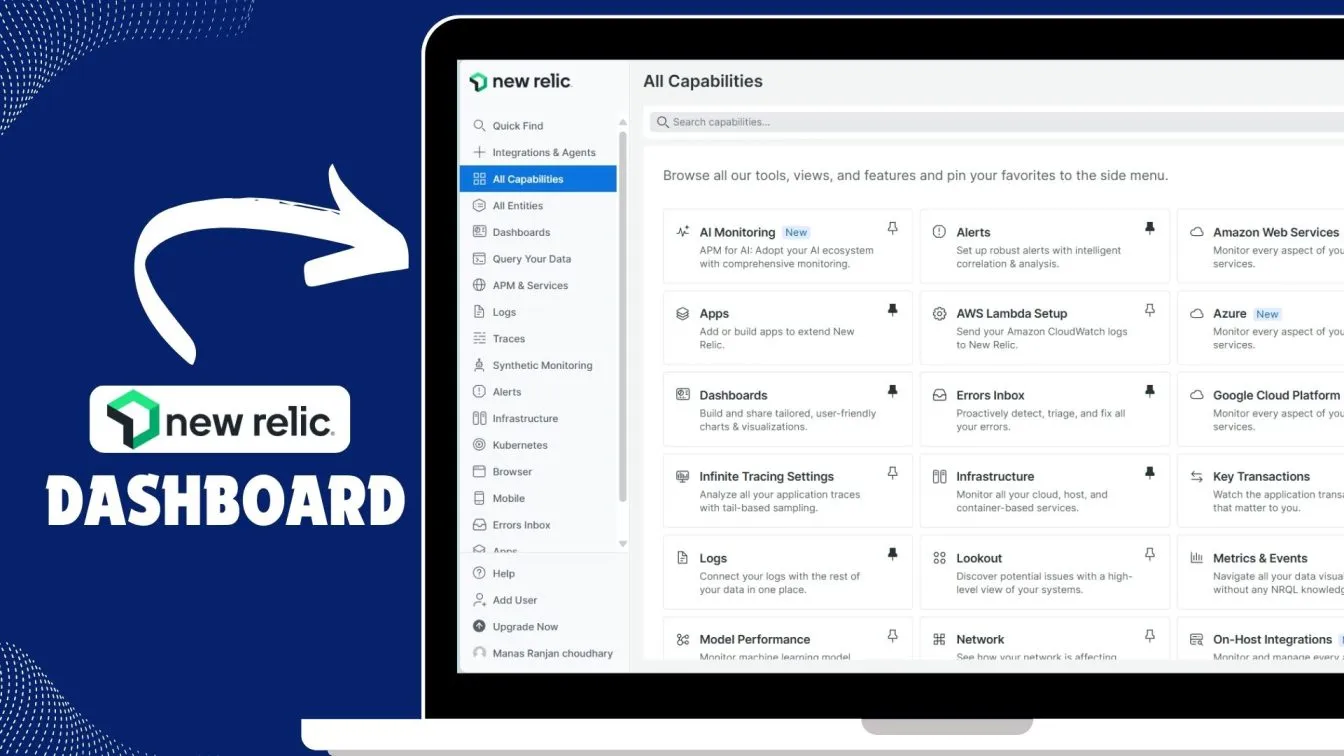
With New Relic, organizations gain full-stack broad visibility across their entire technology stack - from front-end applications to back-end servers ensuring all components function seamlessly together. 🔗 This holistic view allows teams to make informed, data-driven decisions that streamline operations and enhance software performance.
Understanding Applied Intelligence
Understanding Applied Intelligence involves leveraging AI and machine learning to extract actionable insights from data. As organizations prioritize data-driven decisions, the significance of applied intelligence grows. This section explores its definition and importance in enhancing operational efficiency.
What is Applied Intelligence?
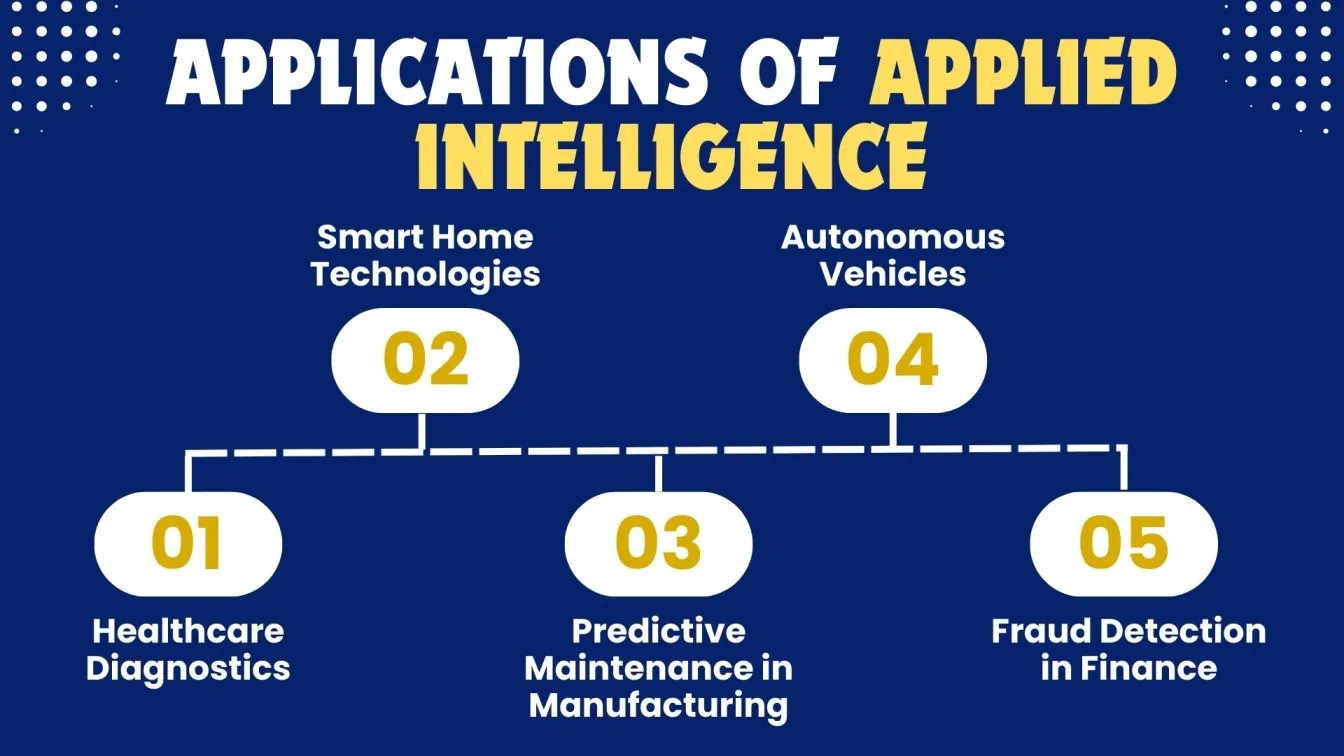
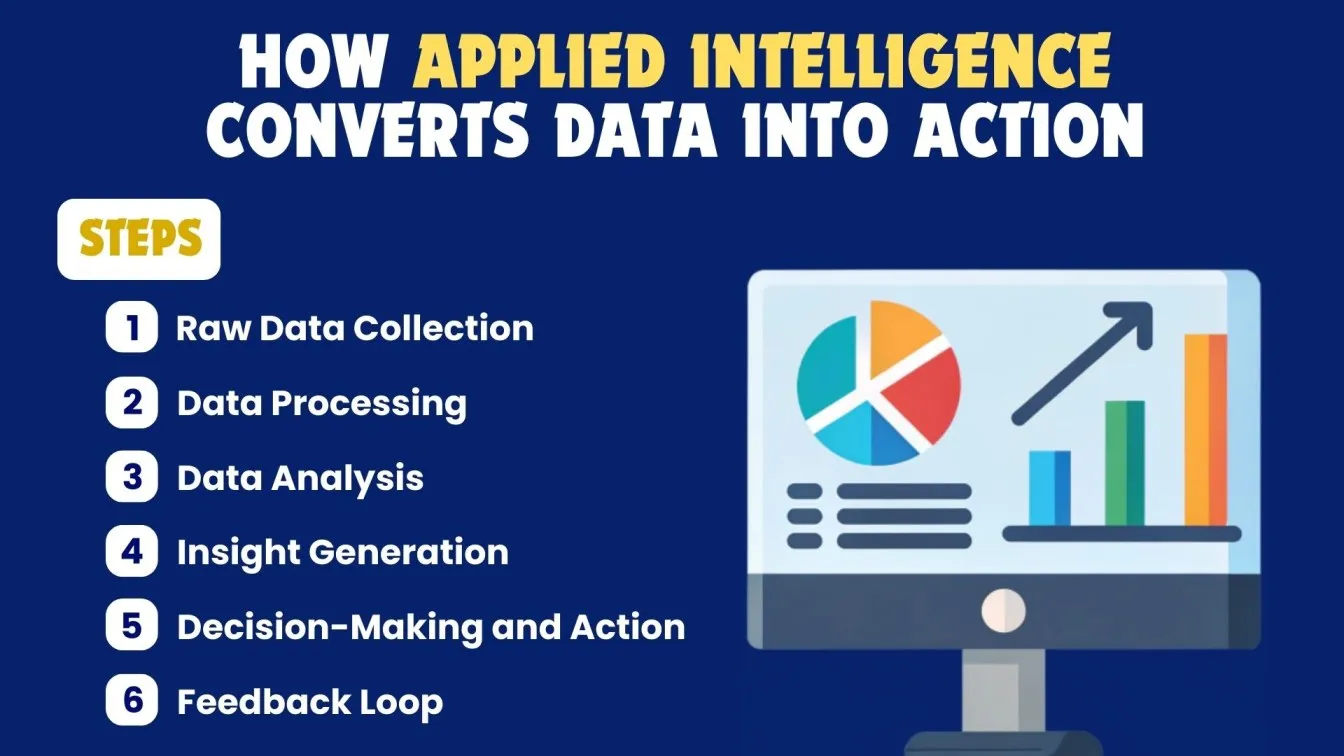
Applied Intelligence is the practical application of artificial intelligence (AI) and machine learning (ML) techniques to analyze data and generate actionable insights. 🌐 It enables organizations to transform vast amounts of data into meaningful information that can inform decision-making, improve operational efficiency, and enhance connected experiences. By leveraging algorithms, statistical models, and advanced analytics, applied intelligence empowers teams to identify patterns, detect anomalies, and predict outcomes more accurately.
The Role of AI in Software Monitoring
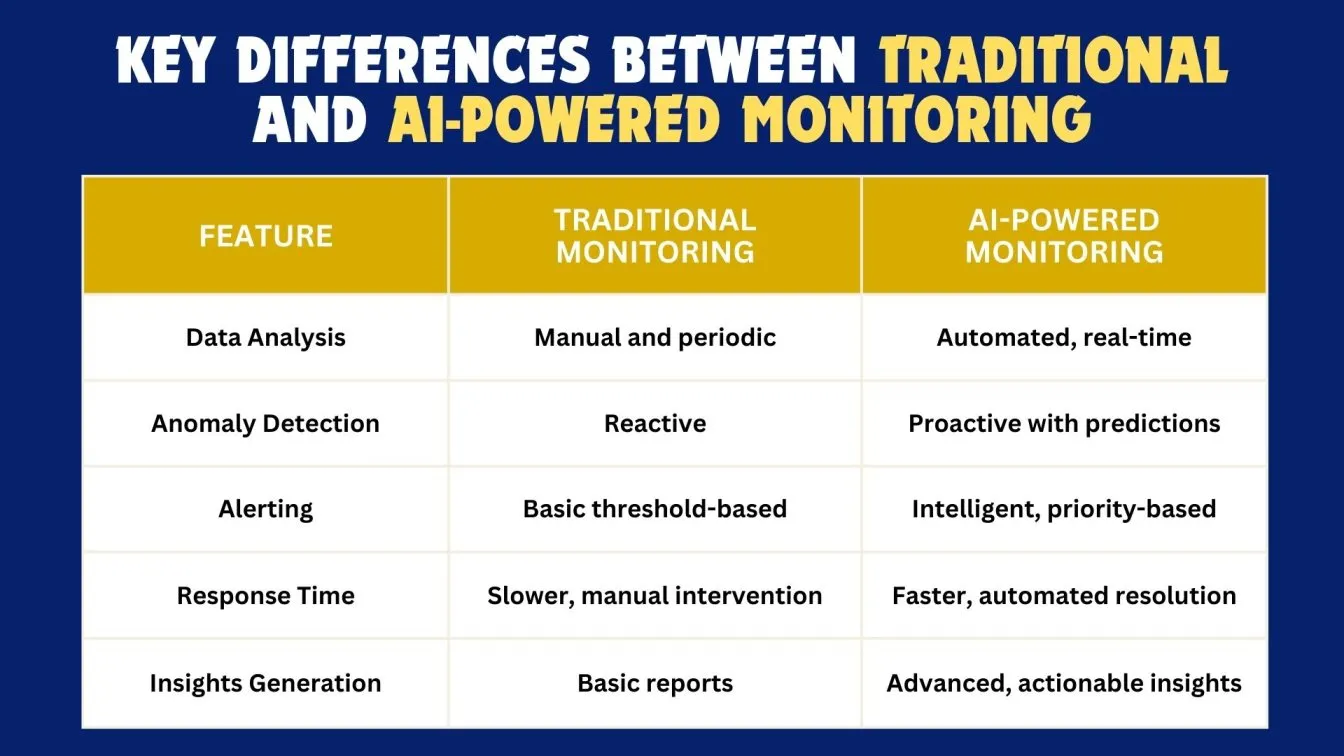
AI has revolutionized how data is collected, processed, and analyzed. Traditional monitoring systems rely on manual processes and fixed thresholds, which can often miss critical issues or respond too late. In contrast, AI-powered monitoring brings real-time data analysis, proactive issue detection, and automated resolution capabilities, making it far more efficient and reliable. Let’s understand the role of AI in software monitoring by exploring the details on software development and the differences it brings.
AI plays a transformative role in software monitoring by automating data analysis and enhancing the detection of performance issues. 🤖 With the ability to process and analyze large datasets quickly, AI algorithms can identify trends and anomalies that might go unnoticed with basic monitoring. This capability enables organizations to:
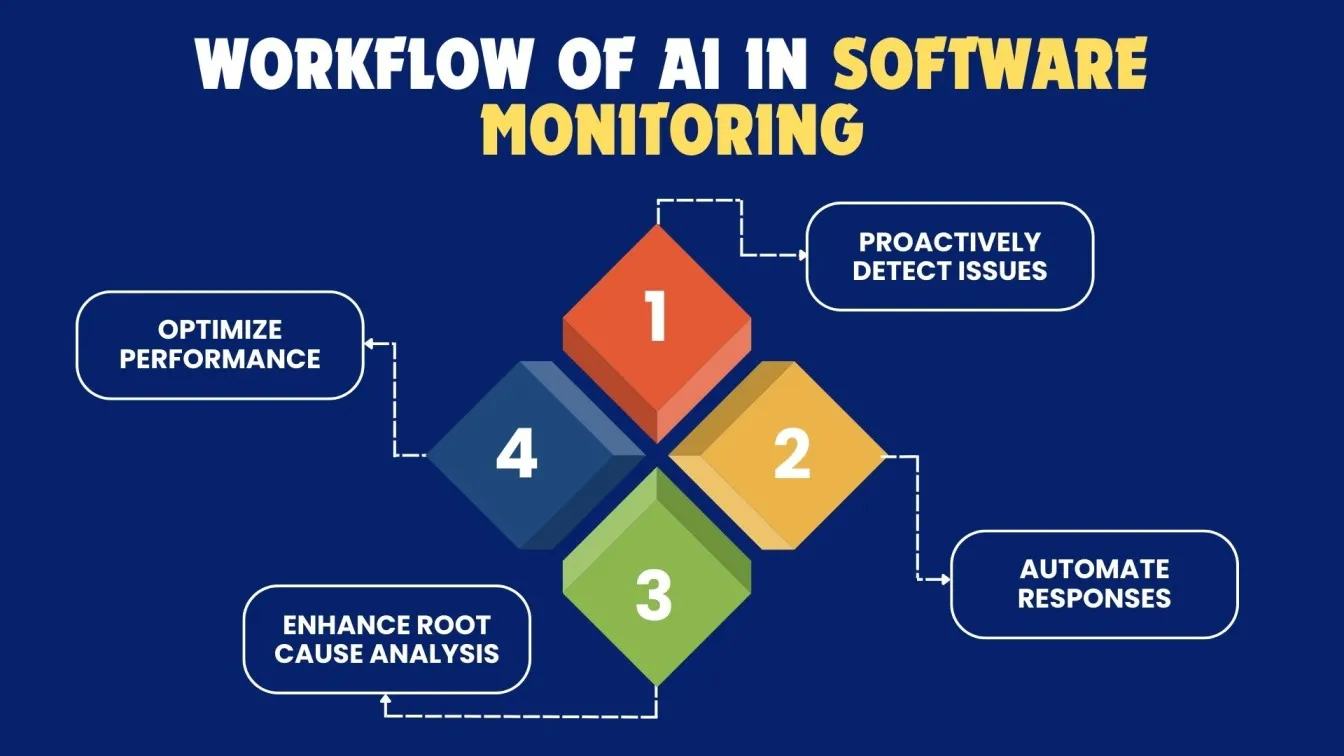
- Proactively Detect Issues: AI algorithms can recognize patterns in historical data and predict potential problems before they escalate, allowing teams to take corrective actions swiftly. 🔍
- Automate Responses: AI-driven tools can automatically respond to incidents based on predefined rules, reducing the need for human intervention and speeding up resolution times. ⚙️
- Enhance Root Cause Analysis: By analyzing multiple data sources, AI can assist in pinpointing the root causes of performance degradation, making it easier for teams to address underlying issues. 🔧
- Optimize Performance: Continuous learning capabilities enable AI systems to adapt and refine their monitoring strategies, improving accuracy over time and ensuring optimal performance of applications. 📈
Key Features of New Relic's Applied Intelligence
New Relic's Applied Intelligence offers powerful features designed to enhance application performance monitoring and management.
Below are two key features that can significantly impact how teams operate and optimize their applications:
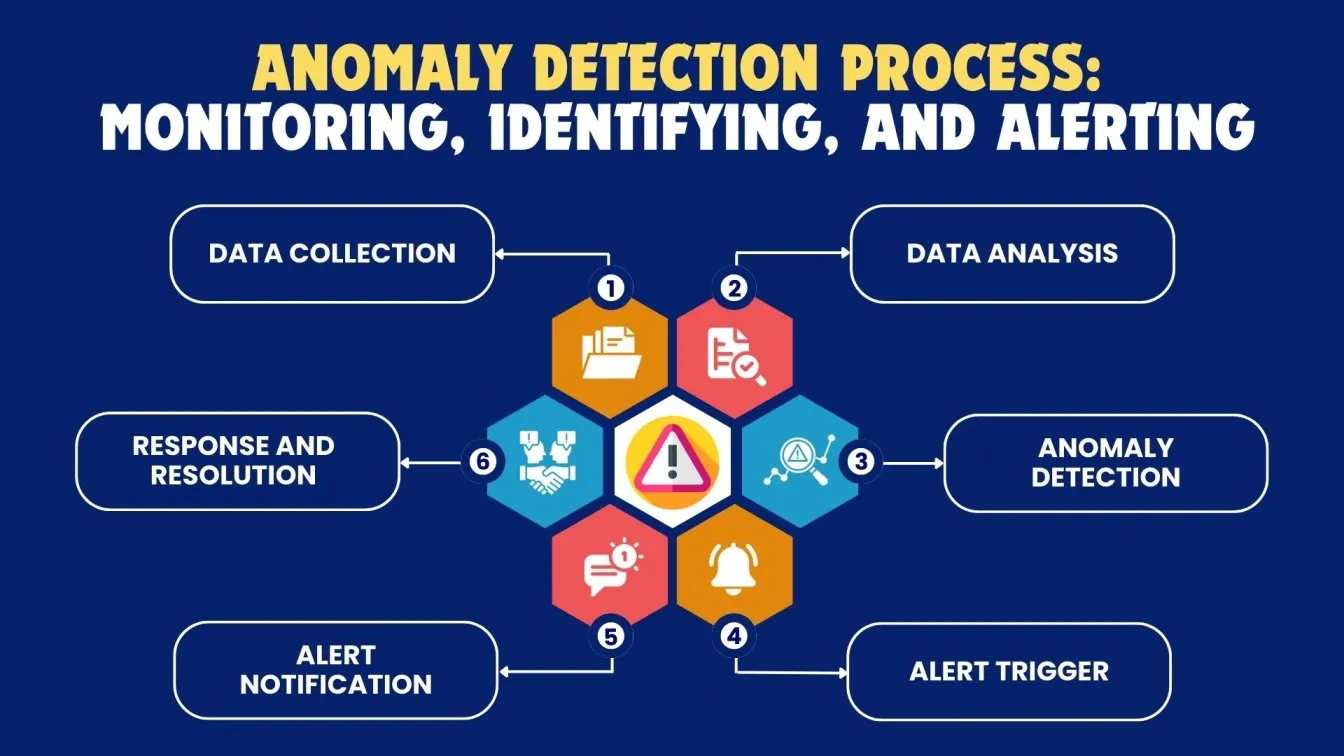
1. Anomaly Detection and Alerts
Anomaly Detection leverages machine learning to monitor application performance metrics in real-time, identifying unusual patterns that may indicate potential issues. This proactive feature enables teams to respond swiftly, preventing downtime and ensuring real user satisfaction.
Example from Netflix:
Netflix utilizes anomaly detection and log management to monitor streaming quality across its global network. When user reports indicate issues with buffering or low-quality streams, New Relic’s anomaly detection can identify if there’s a sudden spike in errors or a drop in streaming quality in specific regions.
For instance, if a CDN (Content Delivery Network) node begins failing, the system automatically alerts the network operations team, allowing them to investigate and resolve the issue before it affects a significant number of users. This capability not only improves the streaming experience but also enhances overall user satisfaction. 📈
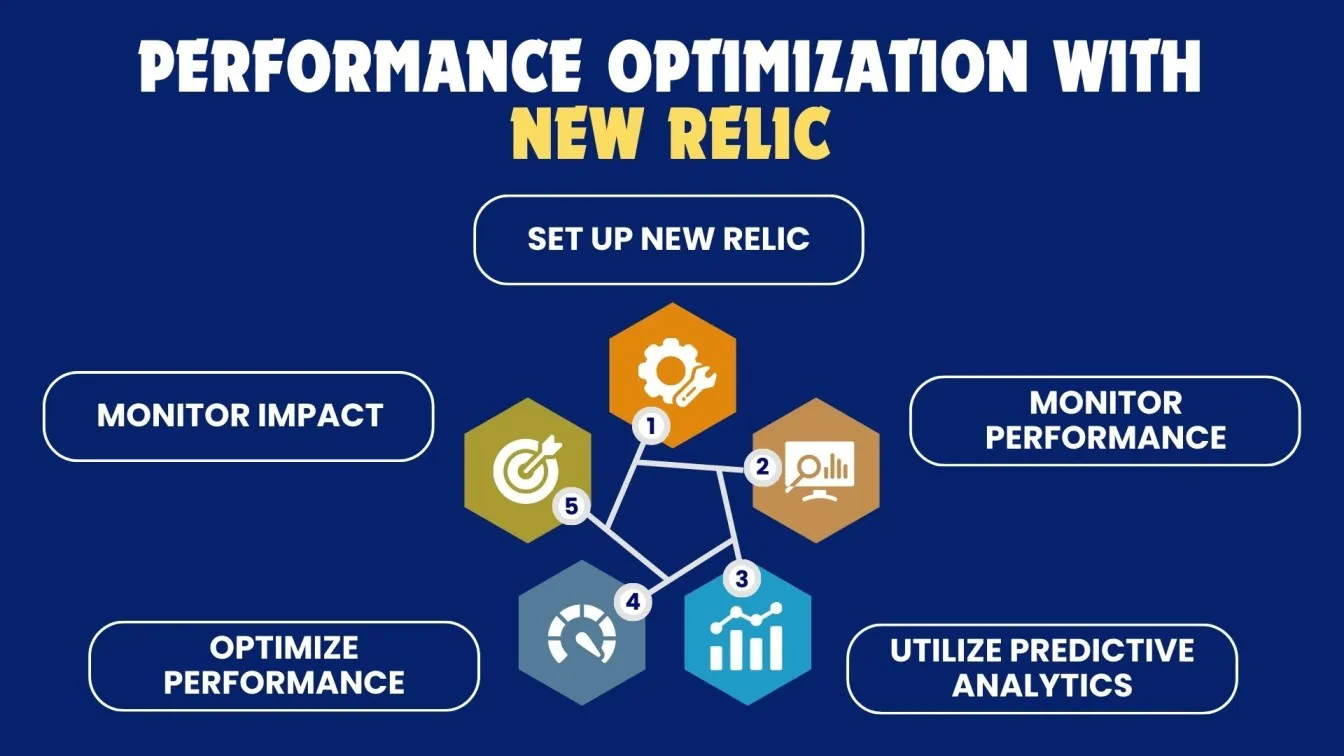
2. Predictive Insights for Performance Optimization
Predictive Insights provide actionable forecasts based on historical data trends, allowing organizations to optimize their application performance and resource management effectively. This feature is essential for anticipating demand and mitigating potential performance bottlenecks.
Example from Airbnb:
Airbnb uses predictive analytics to optimize its platform's performance during high-demand events, like major holidays or festivals. By analyzing historical booking data, New Relic can forecast peak traffic periods.
For instance, if the data indicates increased bookings in New York during the New Year’s Eve celebrations, Airbnb’s operations team can pre-emptively allocate additional server resources to ensure that the platform remains responsive. This proactive approach, including robust error tracking, minimizes the risk of slow response times and booking errors, enhancing the overall user experience during critical times.
Integrating New Relic with Software Stack
Integrating New Relic into your software tech stack is essential for obtaining real-time insights and enhancing the overall performance of your applications through full stack monitoring.
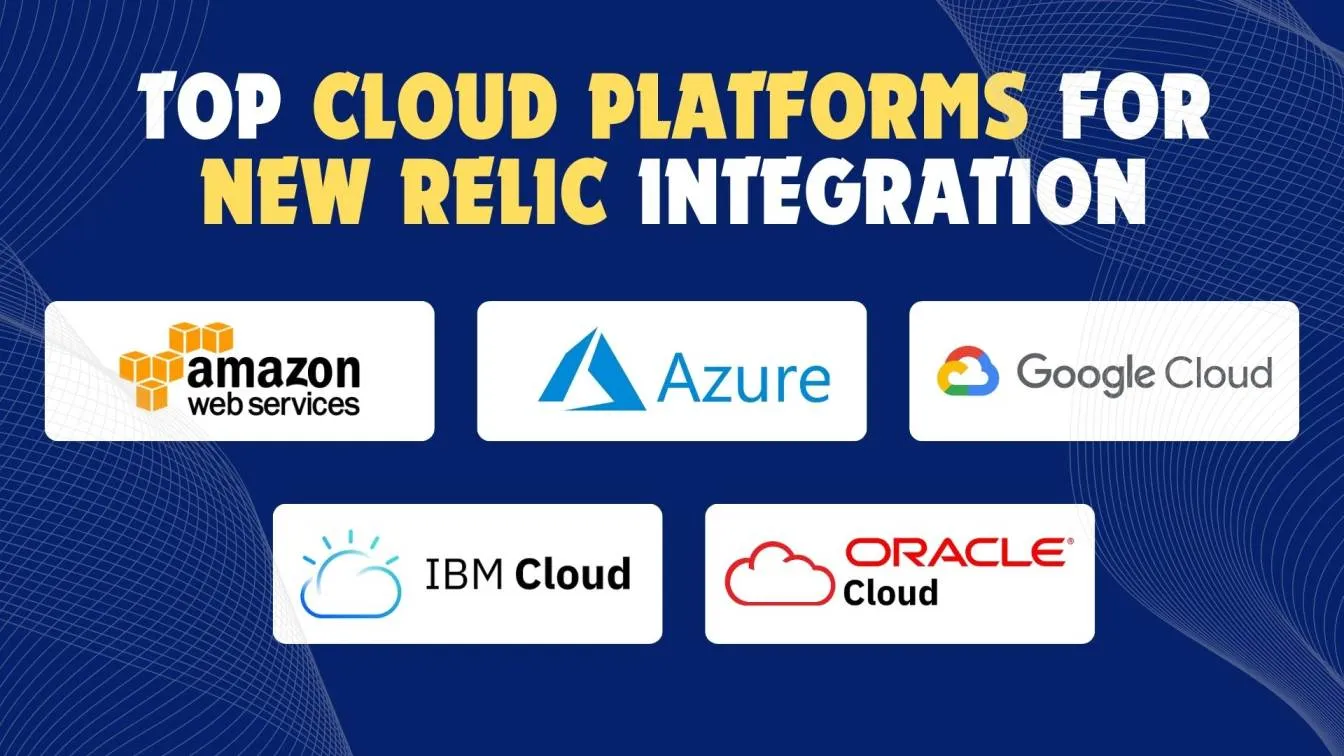
- Cloud Services: New Relic can seamlessly integrate with popular cloud platforms like AWS, Microsoft Azure, Google Cloud Platform, IBM Cloud, and Oracle Cloud, enabling complex infrastructure monitoring. This allows you to monitor your cloud infrastructure, serverless functions, and resources in real-time. For example, you can track metrics such as CPU utilization, memory usage, and error rates across different cloud services.
- Microservices: If you are using a microservices architecture, New Relic provides integration options for container orchestration tools such as Kubernetes and Docker. By monitoring your microservices and implementing browser monitoring, you can identify bottlenecks, optimize resource allocation, and improve the overall performance of your distributed systems.
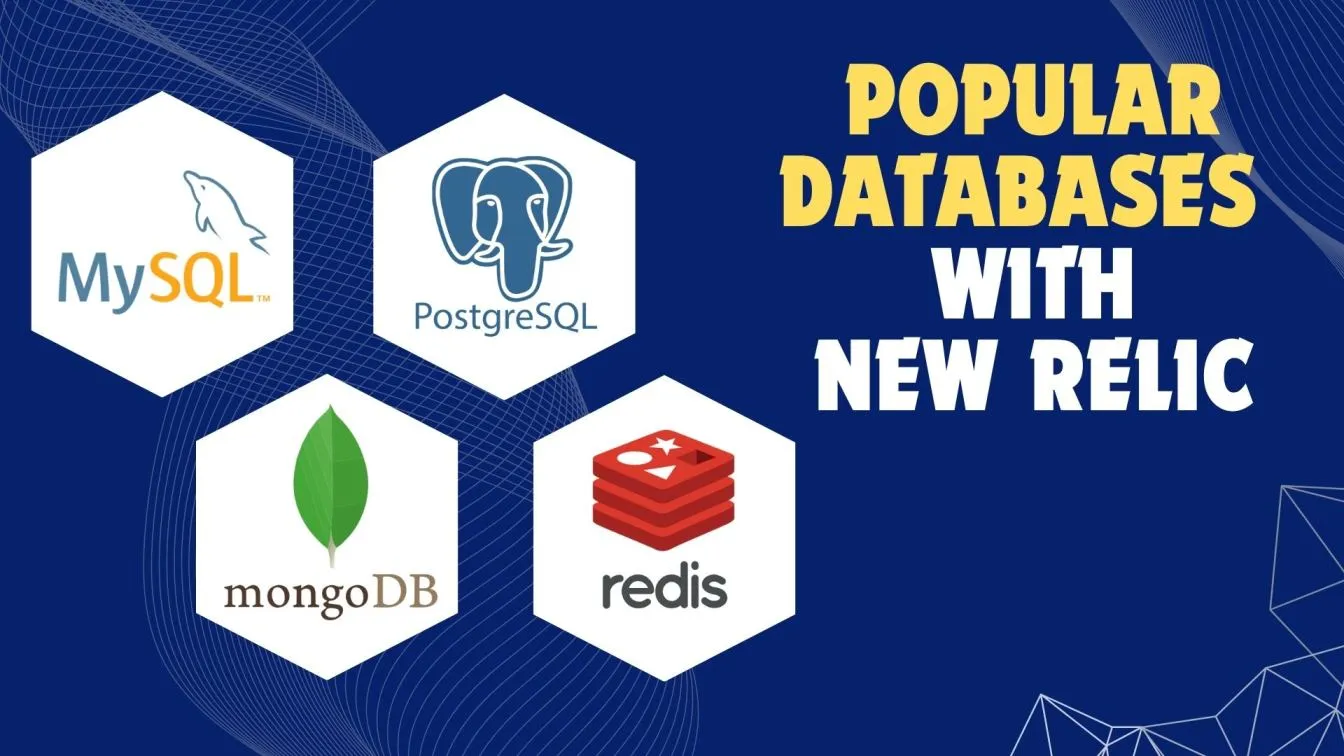
- Databases: To monitor database performance, New Relic monitoring supports integration with a variety of database systems, including MySQL, PostgreSQL, MongoDB, and Redis. This integration allows you to track query performance, slow queries, and overall database health, helping you optimize your database operations.
Steps for Integration
To effectively integrate New Relic into your software environment, follow these steps to ensure seamless monitoring and performance optimization:
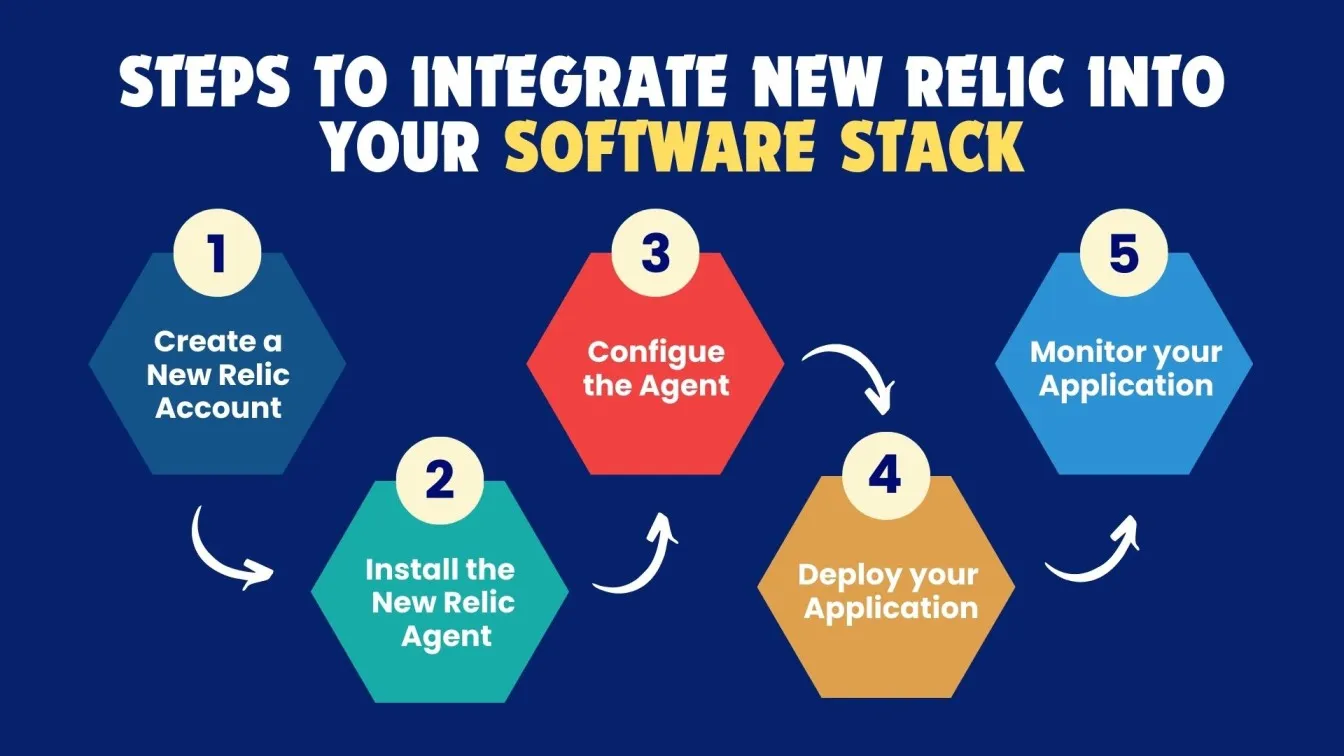
- Create a New Relic Account: Sign up for an account and complete the New Relic login to set up your organization’s dashboard.
- Install the New Relic Agent: Choose the appropriate agent for your application’s language (e.g., Java, Node.js,Python) and follow the installation instructions.
- Configure the Agent: Modify configuration files to include your New Relic license key and application name.
- Deploy your Application: Deploy your application with the New Relic agent integrated.
- Monitor your Application: Access the New Relic dashboard to view performance metrics, error rates, and other analytics.
Real-World Examples of New Relic Integration
Integrating New Relic software into various application stacks has helped numerous organizations across different industries achieve significant improvements in application performance, customer experience, and operational efficiency.
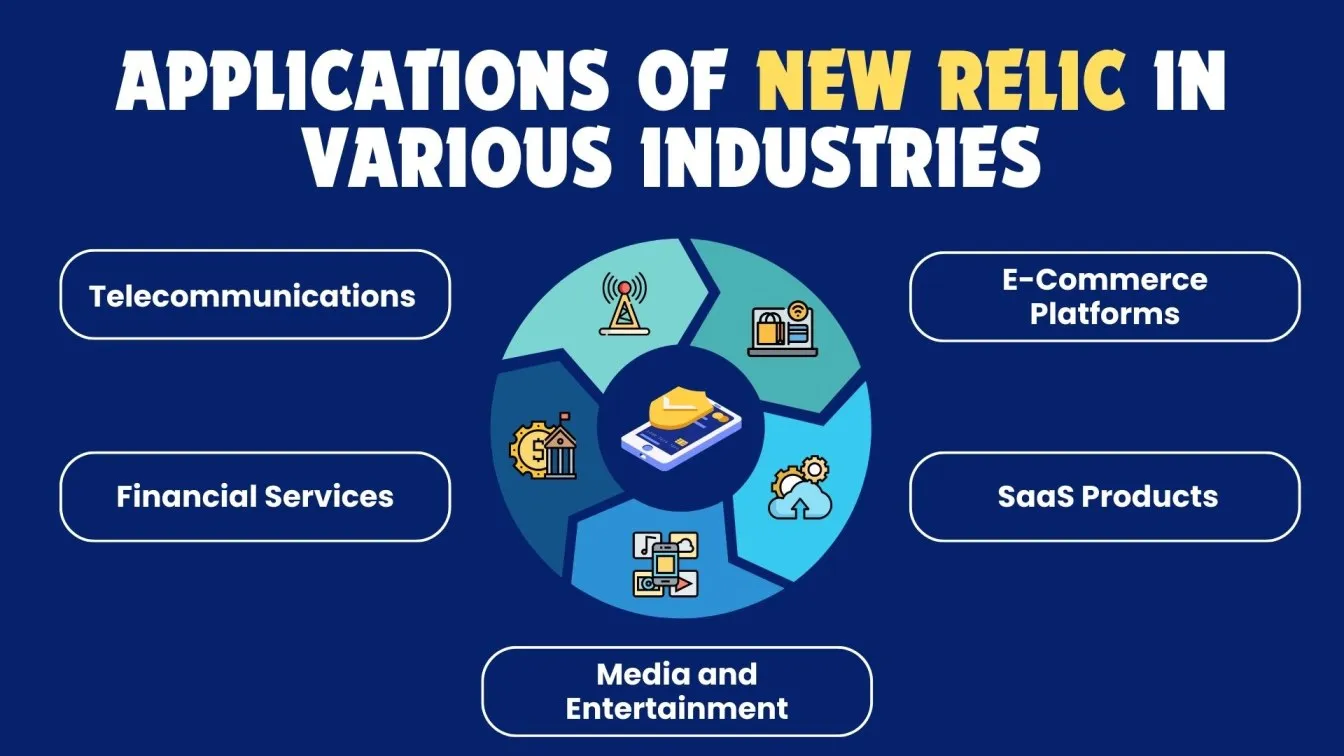
Here are detailed examples of how specific companies leverage New Relic's capabilities:
1. E-Commerce Platforms: Shopify
As a leading e-commerce platform, Shopify experiences high traffic, especially during major sales events like Black Friday and Cyber Monday. The challenge lies in ensuring that the centralized platform remains responsive and reliable under peak load conditions.
Shopify🛍️ integrated New Relic’s (APM) Application Performance Monitoring tools to monitor their platform’s performance metrics in real-time. This includes tracking server response times, transaction times, and error rates across their applications.
2. SaaS Products: Slack
Slack, a popular collaboration tool, must maintain high performance and uptime to support its millions of users worldwide. The challenge is to monitor application performance across multiple services in real time and quickly address any issues.
Slack💬 integrated New Relic’s monitoring tools to track the performance of its services, including message delivery times, API response times, and server health metrics.
3. Media and Entertainment: Hulu
As a streaming service, Hulu must deliver high-quality video content to millions of users simultaneously. During major events, such as the premiere of popular shows, the platform faces a significant increase in traffic, which can lead to performance degradation if not managed properly.
Hulu🎥 utilizes New Relic’s monitoring solutions to keep track of video streaming performance, server load, and user engagement metrics.
4. Financial Services: Fidelity Investments
Fidelity Investments offers a suite of financial services and tools that require high reliability and performance. With a large user base accessing their services online, the company must ensure that all transactions and interactions are smooth and adhere to strict security practices.
Fidelity🏦 integrated New Relic to monitor the performance of its web applications and backend systems, focusing on transaction processing times and system health.
5. Telecommunications: T-Mobile
T-Mobile provides wireless services to millions of customers, and it needs to ensure optimal network performance at all times. With frequent updates and new service rollouts, monitoring and optimizing performance is a continuous challenge.
T-Mobile📶 utilizes New Relic to monitor network performance, customer interactions, and application health across their various services.
Future Trends in Applied Intelligence
Applied intelligence is revolutionizing organizational operations, becoming vital for efficiency and excellence in the digital transformation era. This section highlights future trends in observability tools, which offer insights into systems and enhance real user experiences. By leveraging AI and machine learning, businesses can proactively address challenges, optimize performance, and maintain competitiveness in a rapidly evolving market.
The Evolution of AI in Observability Tools
As technology evolves, applied intelligence 🤖 in observability tools 🔍 is transforming how organizations monitor and manage software systems. These tools are essential for achieving optimal application performance, enhancing user experience, and ensuring system reliability. Here are the key trends shaping the future of applied intelligence in this area:
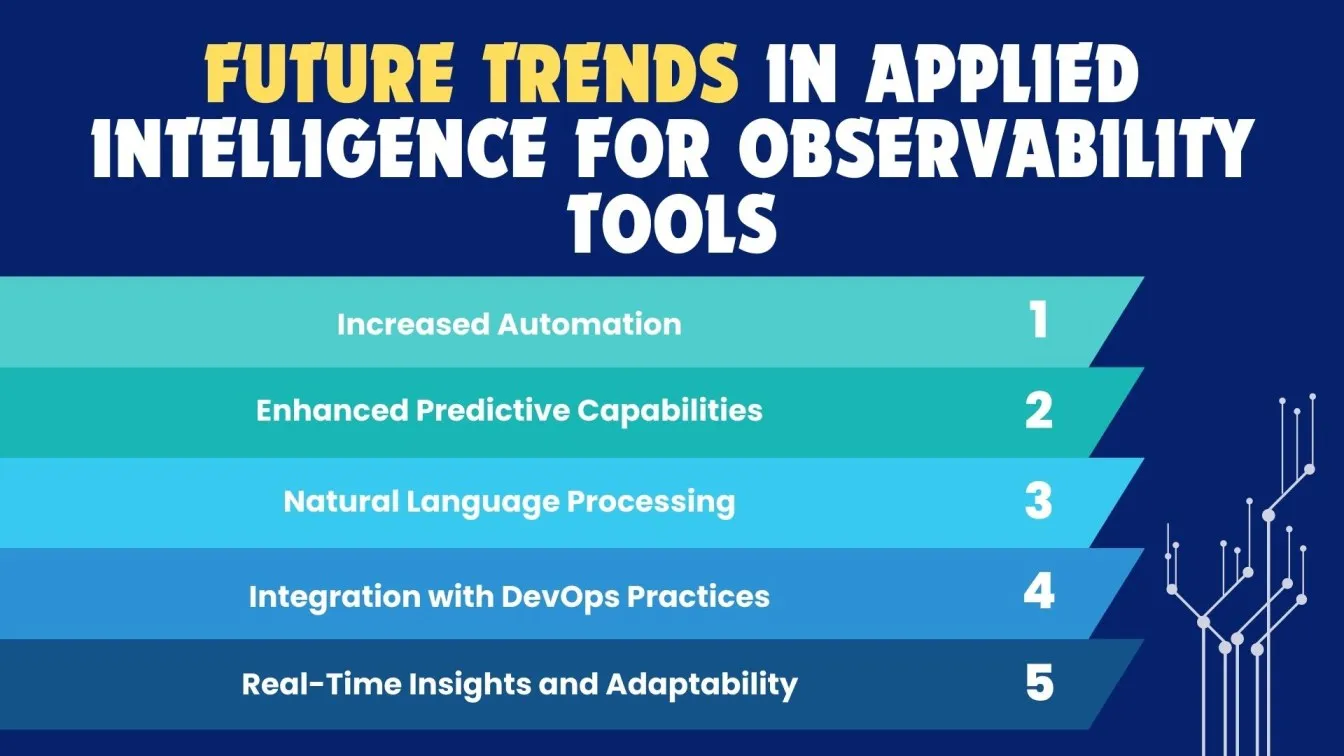
1. Increased Automation 🤖⚙️
The integration of artificial intelligence will significantly enhance automation in observability tools. This trend will include:
- Automated Anomaly Detection 🤖: AI algorithms will analyze performance metrics in real-time, spotting unusual patterns that indicate potential issues, reducing manual monitoring, and enabling quicker responses.
- Self-Healing Systems 🔧: Future tools may have self-healing capabilities, allowing systems to automatically resolve common issues, like restarting services or scaling resources when response times exceed set thresholds.
- Proactive Incident Management ⚠️: AI will automate incident management by categorizing and prioritizing alerts, helping teams focus on critical issues first, reducing alert fatigue, and ensuring timely resolutions.
2. Enhanced Predictive Capabilities 📈🔮
As AI technologies mature, the predictive capabilities of full stack observability tools will become more refined, allowing organizations to:
- Forecast Performance Issues 📈: AI will predict bottlenecks using historical data, helping allocate resources during peak times.
- User Behavior Insights 👥: AI analyzes interactions to provide insights into future user behavior, enhancing customer satisfaction.
- Resource Optimization ⚙️: AI will optimize resource allocation during high-traffic periods, minimizing downtime and ensuring performance.
3. Natural Language Processing (NLP) 🗣️💬
The integration of natural language processing (NLP) in observability tools will transform how basic users interact with telemetry data:
- Intuitive Querying 🗣️: Users can ask performance metrics in everyday language, making it easy for non-technical stakeholders to understand, like asking, "What were the peak usage times last week?"
- Enhanced Reporting 📊: NLP will automate report generation, summarizing key insights in natural language for quick understanding without the need to analyze complex data.
- Conversational Interfaces 💬: Future tools may feature chatbots, allowing users to interact conversationally, gain comprehensive insights, and initiate troubleshooting through dialogue.
4. Integration with DevOps Practices 🔄👩💻
The seamless integration of AI into DevOps workflows will enhance collaboration within the DevOps community, strengthening ties between development and operations teams for more efficient and effective workflows.
- Continuous Feedback Loop 🔄: AI will create a feedback loop between the development team and operations, using performance data to refine future practices.
- Faster Incident Resolution ⚡: Real-time insights will enable quicker incident resolution, with AI alerting teams to issues and suggesting rollbacks when needed.
- Collaboration Tools 🤝: AI will enhance collaboration tools, improving communication and coordination between teams for efficient workflows.
5. Real-Time Insights and Adaptability ⏱️🔄
The future of observability tools will be defined by their ability to provide real-time insights and adapt to changing conditions within observability capabilities.
- Real-Time Monitoring ⏱️: Continuous system performance monitoring will help organizations detect issues immediately, allowing for quick reactions and minimizing user experience impact.
- Dynamic Adaptability ⚙️: AI systems will automatically adjust monitoring strategies based on real-time data, optimizing performance without manual configuration, such as reallocating resources during high load.
- Enhanced User Experience 🌟: Real-time insights will enable organizations to refine applications continuously based on user interactions, ensuring optimal performance and user satisfaction.
Conclusion
In this blog, we talked about New Relic's advanced applied intelligence capabilities 🤖, showcasing its pivotal role in enhancing software monitoring for modern applications 📊. We explored how anomaly detection 🚨 and predictive insights 🔮 empower software teams to respond swiftly to incidents and proactively manage their comprehensive observability practices. The real-world examples illustrated New Relic's versatility across wide range of industries, from e-commerce 🛒 to telecommunications 📶.
Furthermore, New Relic’s event intelligence capabilities enable organizations to gain deeper insights into system behaviors, facilitating complex reasoning when addressing performance issues. By integrating New Relic into their software full stacks, organizations can optimize performance, improve user experiences 🌟, and maintain a competitive edge in an increasingly complex digital landscape. Embracing these advanced capabilities not only drives operational efficiency ⚙️ but also fosters innovation in service delivery 🚀, and enhances digital experience monitoring, making it easier for teams to shop for observability solutions tailored to their specific needs while enhancing their development operations.
People also asked
👉How to use New Relic effectively?
Use New Relic by creating custom dashboards, leveraging AI for insights, setting up alerts, and enabling distributed tracing for optimal application performance.
👉What is the difference between New Relic and Splunk?
New Relic is designed for application performance monitoring, providing real-time insights into app metrics. Splunk, on the other hand, focuses on log management and data analytics for a variety of data sources.
👉What are the benefits of using New Relic?
New Relic offers real-time insights, comprehensive monitoring, improved performance, scalability, and enhanced collaboration between teams.
👉Does New Relic use AI?
Yes, New Relic utilizes AI and machine learning for automated anomaly detection, predictive analytics, and efficient incident management.
%201.webp)