In the realm of software development and modern architecture, ensuring system reliability requires more than just basic monitoring. While traditional monitoring tools focus on predefined metrics and quick response times, observability goes further by providing actionable insights and a deeper understanding of internal processes. Observability solutions empower DevOps teams and operations teams to address complex issues, identify potential failures, and allocate resources efficiently. As hybrid environments and production environments grow increasingly complex, adopting a proactive approach combining monitoring capabilities and comprehensive observability becomes crucial for tackling unknown issues and enhancing application monitoring.
Let’s dive further to learn observability vs monitoring !
Introduction to Monitoring and Observability
System performance and dependability must be ensured in contemporary IT environments.
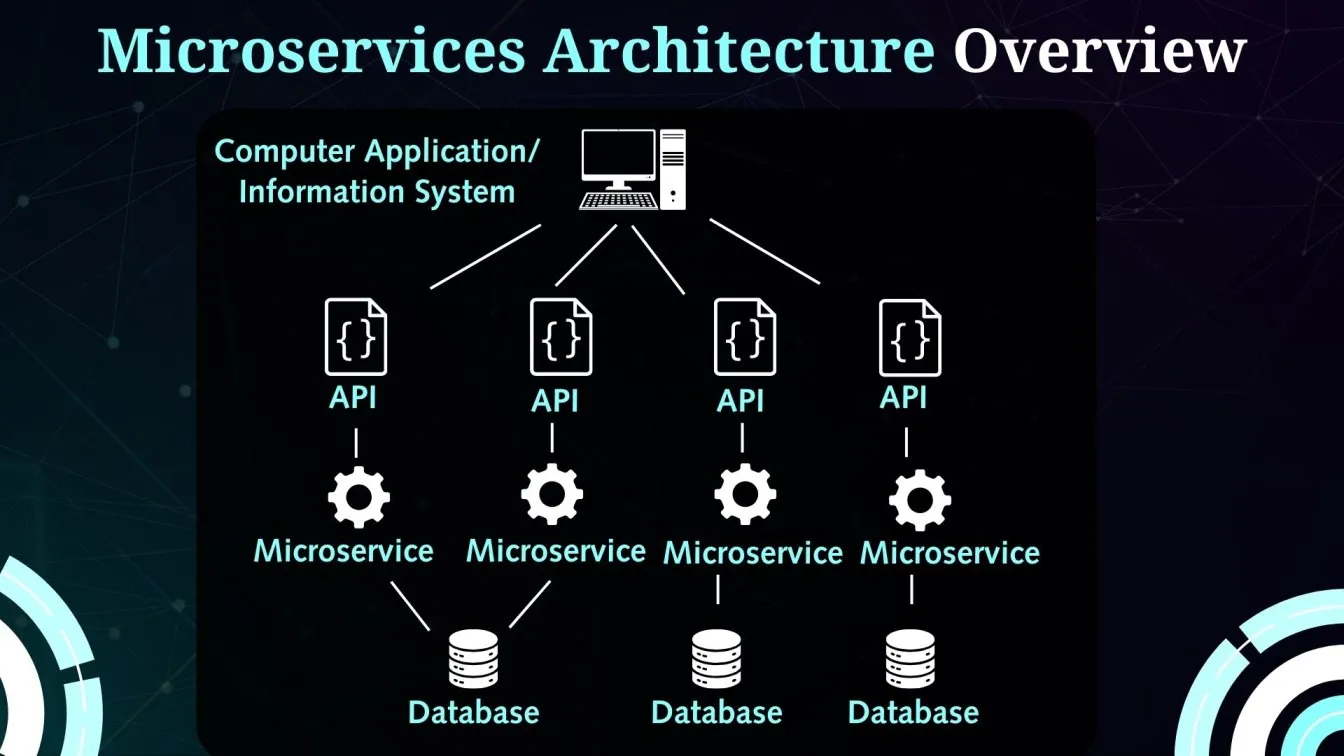
Since building microservices architectures have supplanted monolithic ones, observability and monitoring have become crucial.
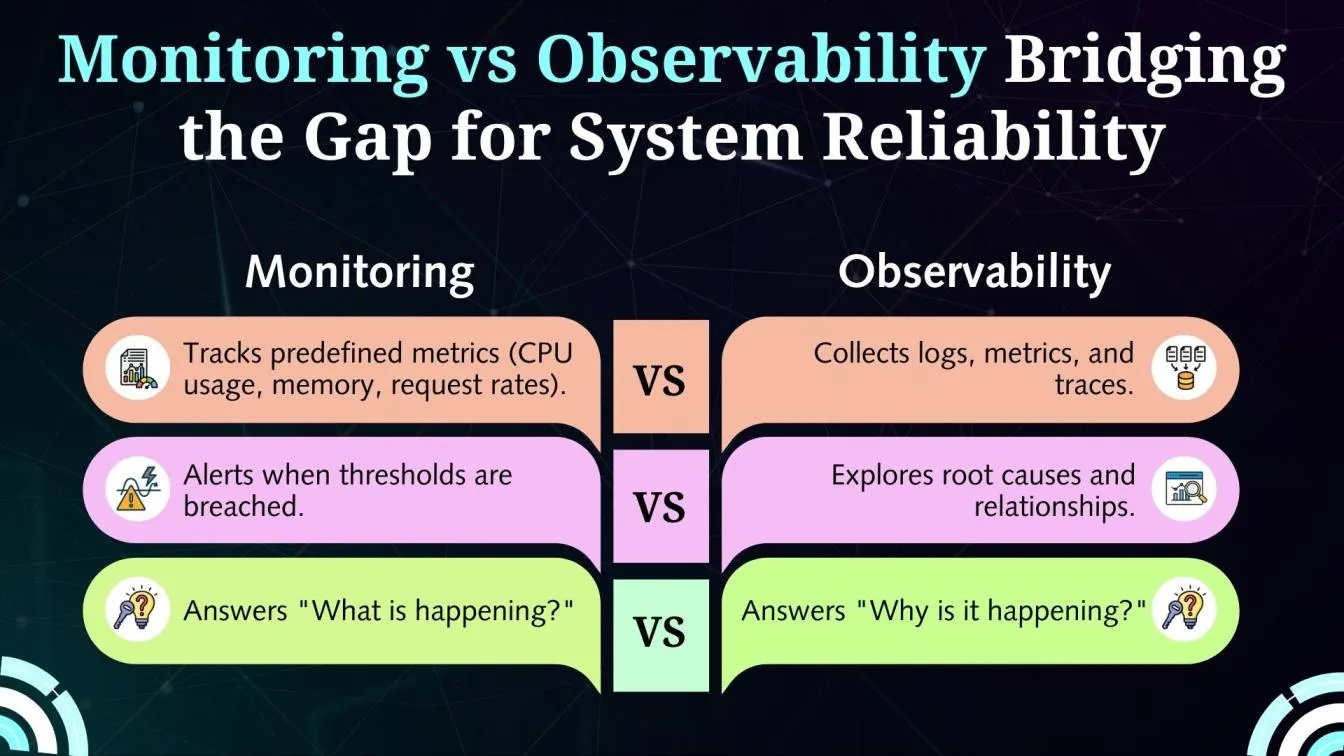
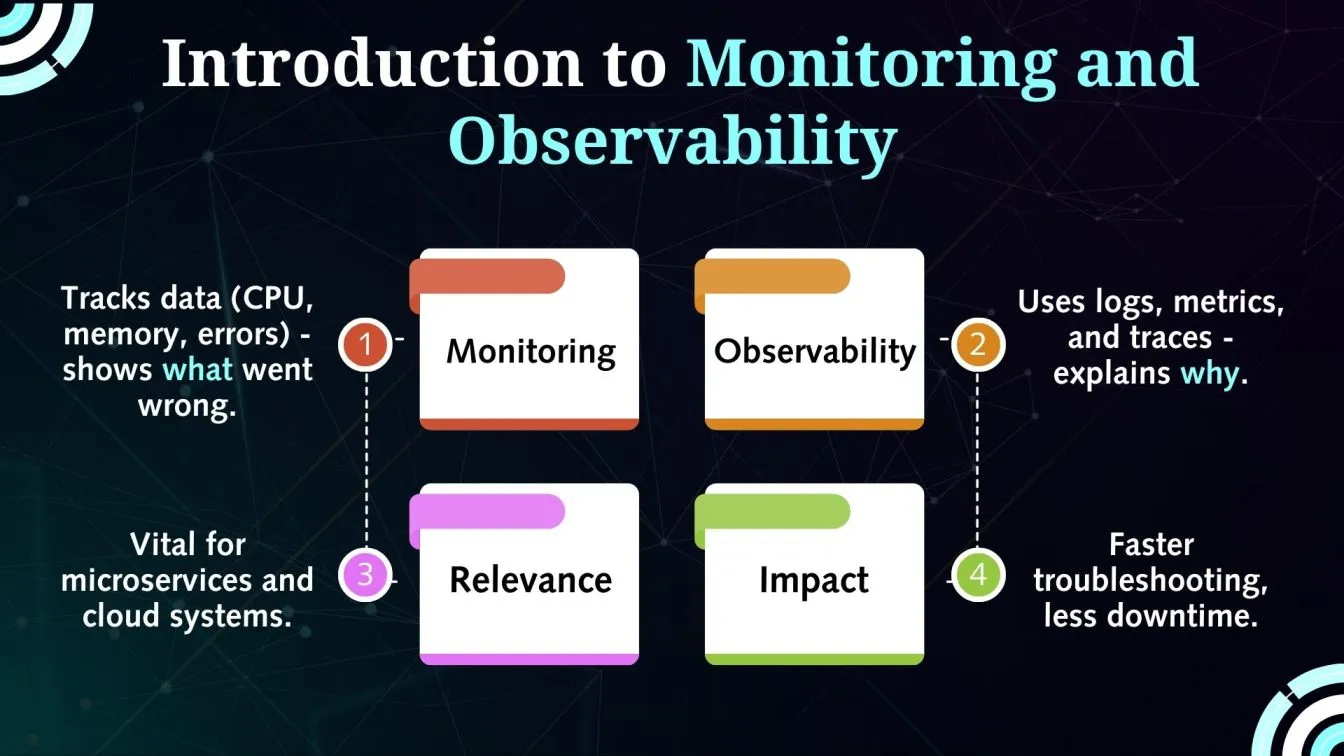
In order to identify system defects, monitoring entails gathering and examining particular data, such as CPU consumption, memory, and error rates.
Observability goes one step further, though, by employing logs, metrics, and traces to provide real-time insights into a system's internal status and help identify the root causes of issues.
Observability tells why, whereas monitoring provides an explanation for what went wrong.
Together, they enhance issue response, enable proactive troubleshooting, and boost performance.
Reducing downtime and guaranteeing seamless operations require the integration of distributed and cloud-native technologies.
Let’s walkthrough further into the topic.
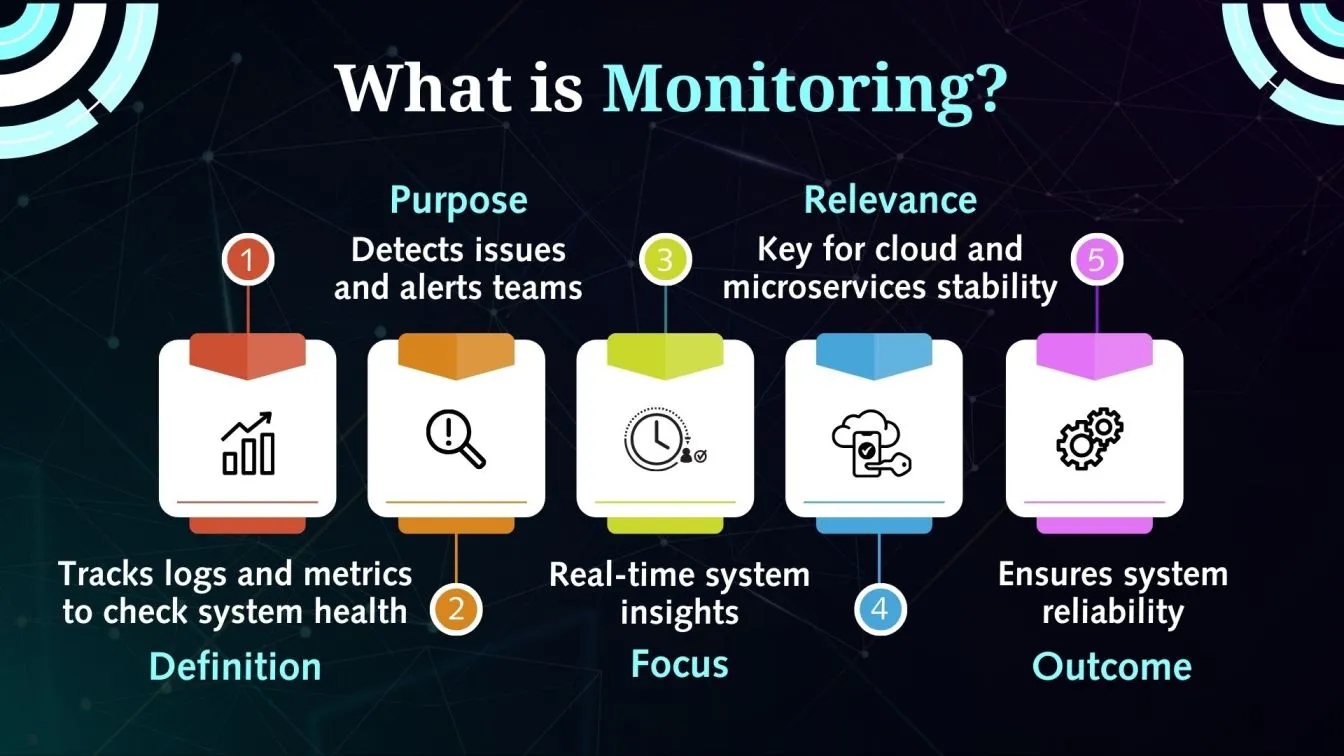
What is Monitoring?
Monitoring is the act of collecting, analyzing, and presenting some logs and metrics to monitor the functionality and health of systems. Finding recognized problems and notifying teams of problems are its main goals. In contemporary IT systems, monitoring—which offers real-time insights into system behavior—is crucial to preserving the stability of cloud architectures and microservices.
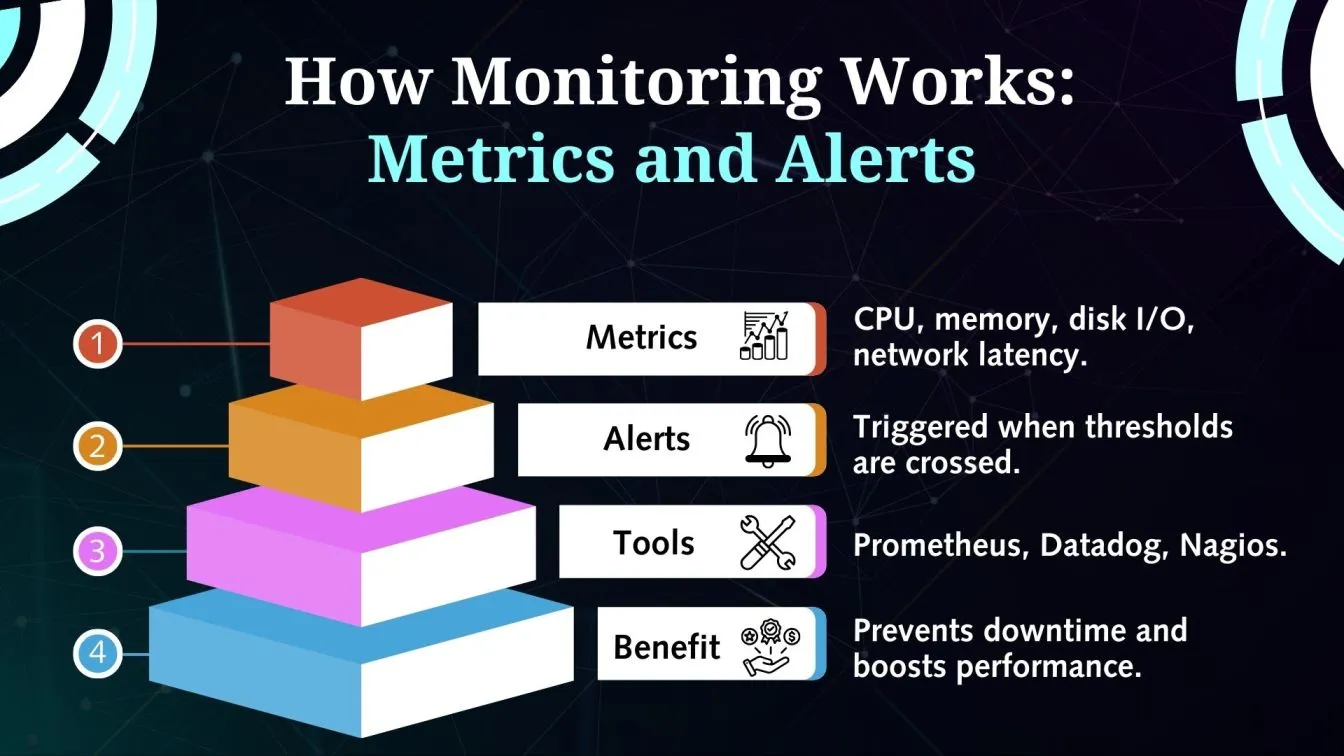
How Monitoring Works: Metrics and Alerts
Monitoring involves the gathering of data points (metrics) like CPU utilization, memory usage, disk I/O, and network latency. These readings are contrasted t predetermined threshold levels. When a threshold is crossed, it automatically triggers alarms, allowing teams to quickly respond before downtime or degradation occurs.
- Tracks predefined metrics: CPU usage, memory, latency, error rates.
- Real-time data: Helps detect known issues and performance anomalies.
- Alerts: Triggered when metrics exceed set thresholds (e.g., high response time).
- Continuous data collection: Ensures quick detection of outages or inefficiencies.
- Dashboards: Provide visual insights for easy monitoring.
- Supports DevOps: Enables prompt response to potential problems.
- Limits: Effective for tracking system status but works best alongside observability for deeper issue analysis.
Teams can address system bottlenecks in advance, ensure smooth operations, and improve overall application performance using these technologies.
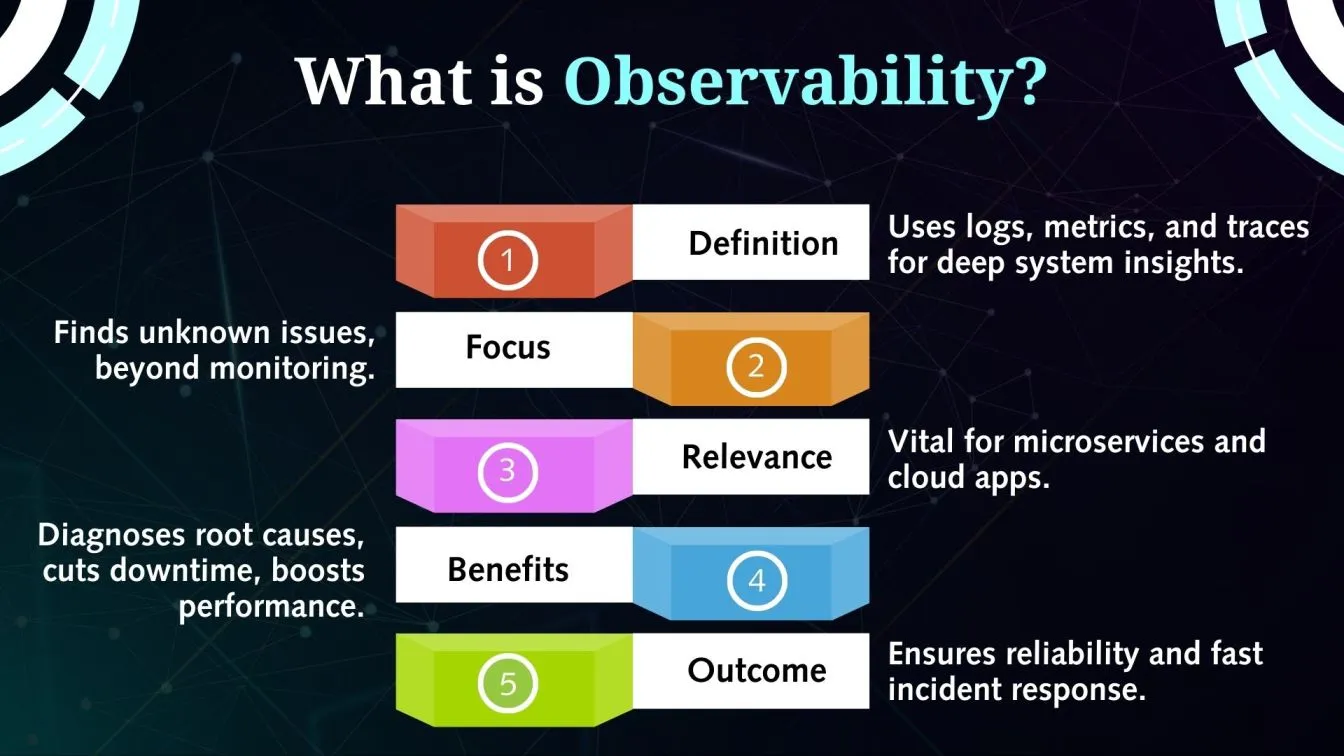
What is Observability?
By providing profound insights into a system's internal status based on the data it generates, observability goes beyond monitoring.
By examining metrics, logs, and traces, observability helps identify undiscovered problems, whereas monitoring concentrates on identifying known failures using established metrics.
Because dynamic and dispersed environments necessitate real-time diagnostics, it is essential for managing complex systems like microservices and cloud-native apps.
Without waiting for preset notifications, teams may use observability to track system performance, identify the underlying cause of occurrences, and proactively troubleshoot problems.
It gives companies the potential to improve application performance, decrease downtime, and increase system reliability.
Observability tool integration guarantees smooth operations and quicker incident response for contemporary cloud systems.
Organizations may maintain robust, high-performing systems and make data-driven decisions by embracing observability.
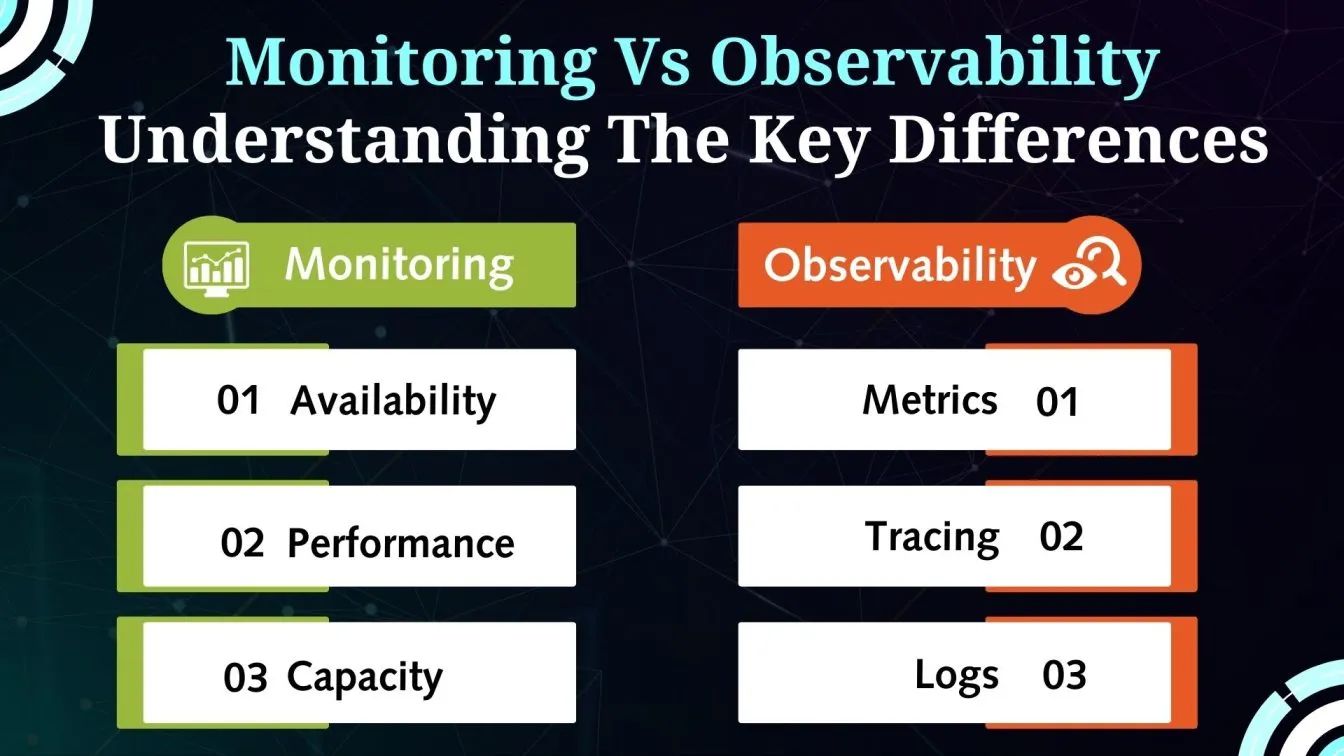
Key Difference Between Observability and Monitoring
Building robust apps requires an understanding of the distinctions between observability and monitoring.
Whereas observability concentrates on identifying unidentified problems, monitoring works with predetermined metrics and alarms.
The question of whether the system is functioning is addressed via monitoring.
Observability provides an explanation for the system's behavior.
Whereas observability thrives in dynamic, cloud-native, and microservices architectures, monitoring is best suited for static, predictable situations.
Monitoring vs. Observability in Microservices: Tracking Dependencies and Failures Effectively
In a microservices architecture, services often depend on each other.
Monitoring microservices tracks individual service health, but observability in microservices helps trace requests across distributed systems, identifying bottlenecks and failures.
For example, consider a cloud-based e-commerce platform using microservices.
Monitoring might alert you to high latency in the checkout service, but observability would trace the request flow and reveal the root cause — perhaps a slow database query or a failing API call. This is why microservices architecture, services often depend on each other.
Cloud Monitoring vs. Observability: Ensuring Real-Time Insights in Cloud Environments
Cloud monitoring and observability work hand-in-hand to maintain the performance of cloud-based applications. Monitoring tracks predefined metrics — like CPU usage, network latency, and error rates — providing real-time data and triggering alerts when thresholds are breached. It focuses on identifying what went wrong. Observability goes beyond by analyzing logs, metrics, and traces, helping teams understand why issues occurred. Together, they ensure quick incident response, deeper root cause analysis, and optimized cloud operations.
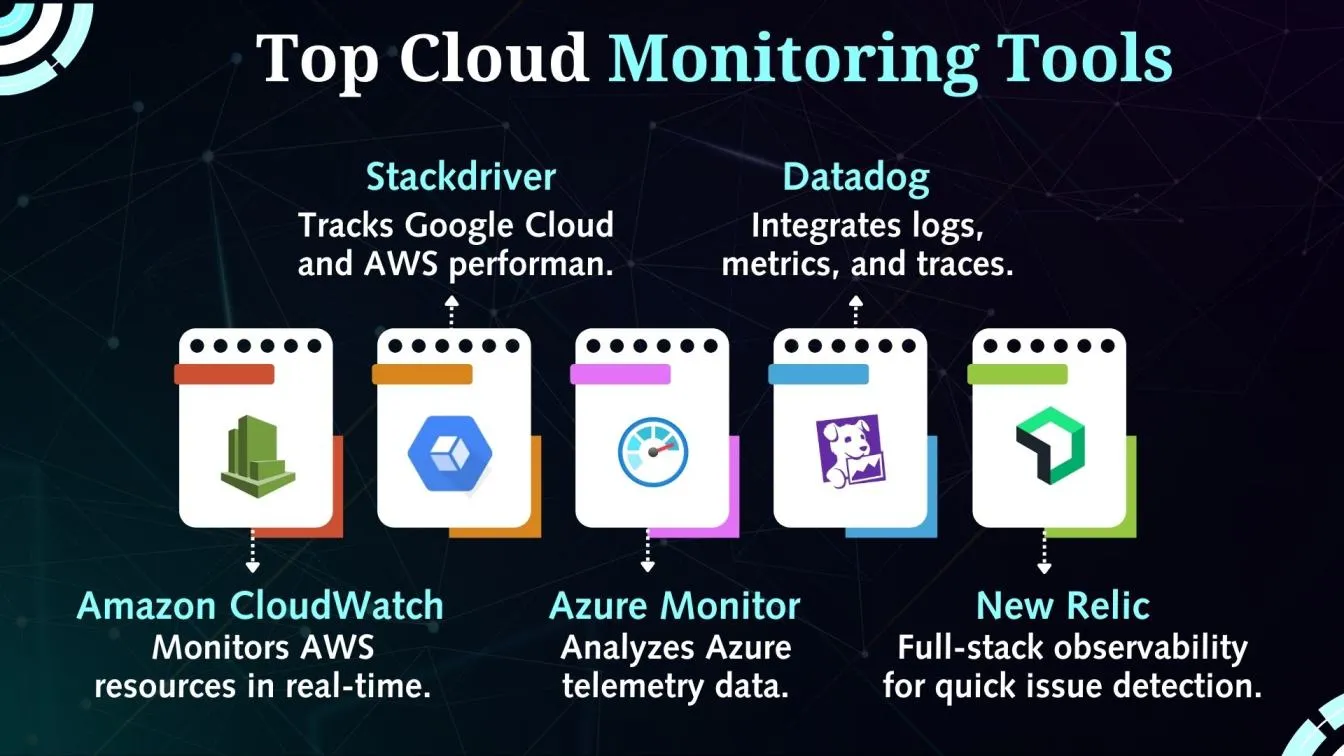
Popular Cloud Monitoring Tools:
Several tools help streamline cloud monitoring and observability:
- Amazon CloudWatch: Monitors AWS cloud resources and applications in real-time.
- Google Cloud Operations Suite (Stackdriver): Provides monitoring, logging, and diagnostics for Google Cloud and AWS.
- Microsoft Azure Monitor: Collects, analyzes, and acts on telemetry data from Azure resources.
- Datadog: Offers end-to-end monitoring for cloud applications, integrating logs, metrics, and traces.
- New Relic: Delivers full-stack observability, helping teams detect and resolve issues faster.
Key Points:
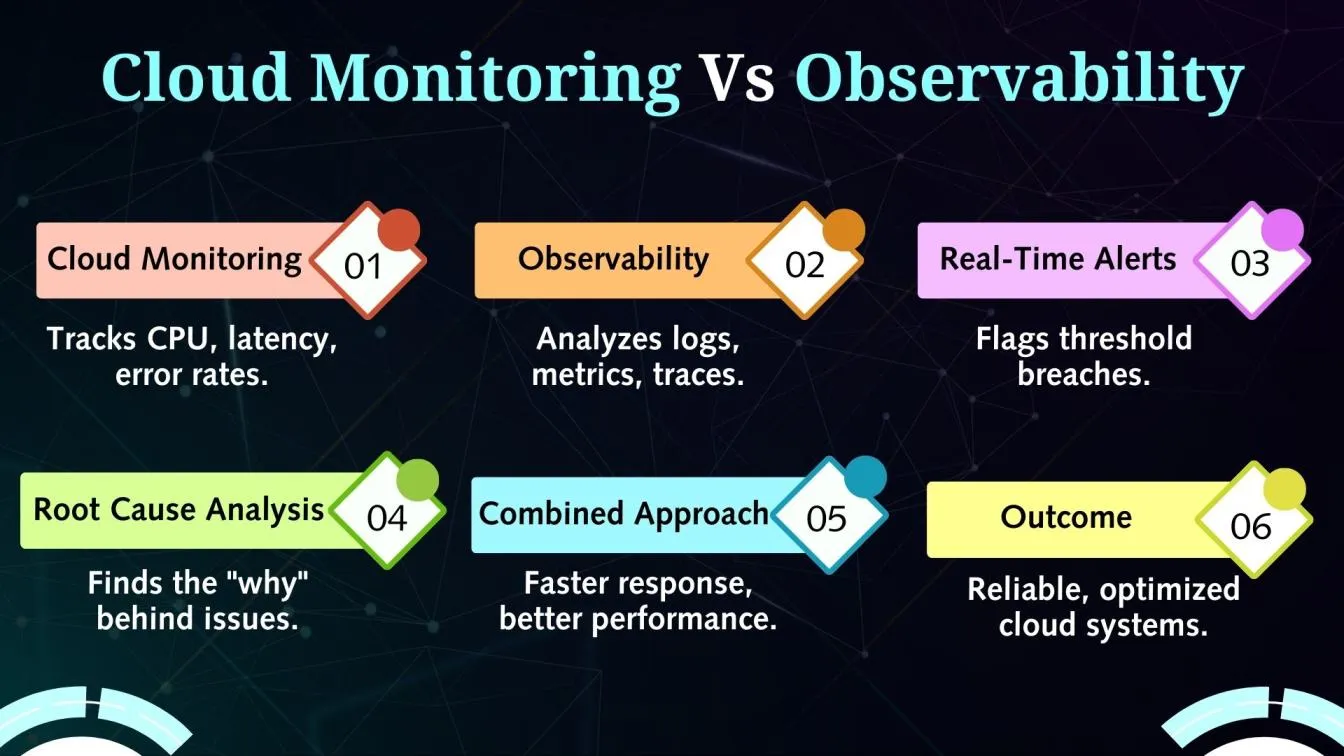
- Cloud Monitoring: Tracks metrics like CPU usage, latency, and error rates.
- Observability: Analyzes logs, metrics, and traces to uncover root causes.
- Real-Time Alerts: Monitoring triggers alerts for threshold breaches.
- Root Cause Analysis: Observability identifies the “why” behind incidents.
- Combined Approach: Ensures quick responses and optimized cloud performance.
- Outcome: Streamlined troubleshooting and enhanced cloud reliability.
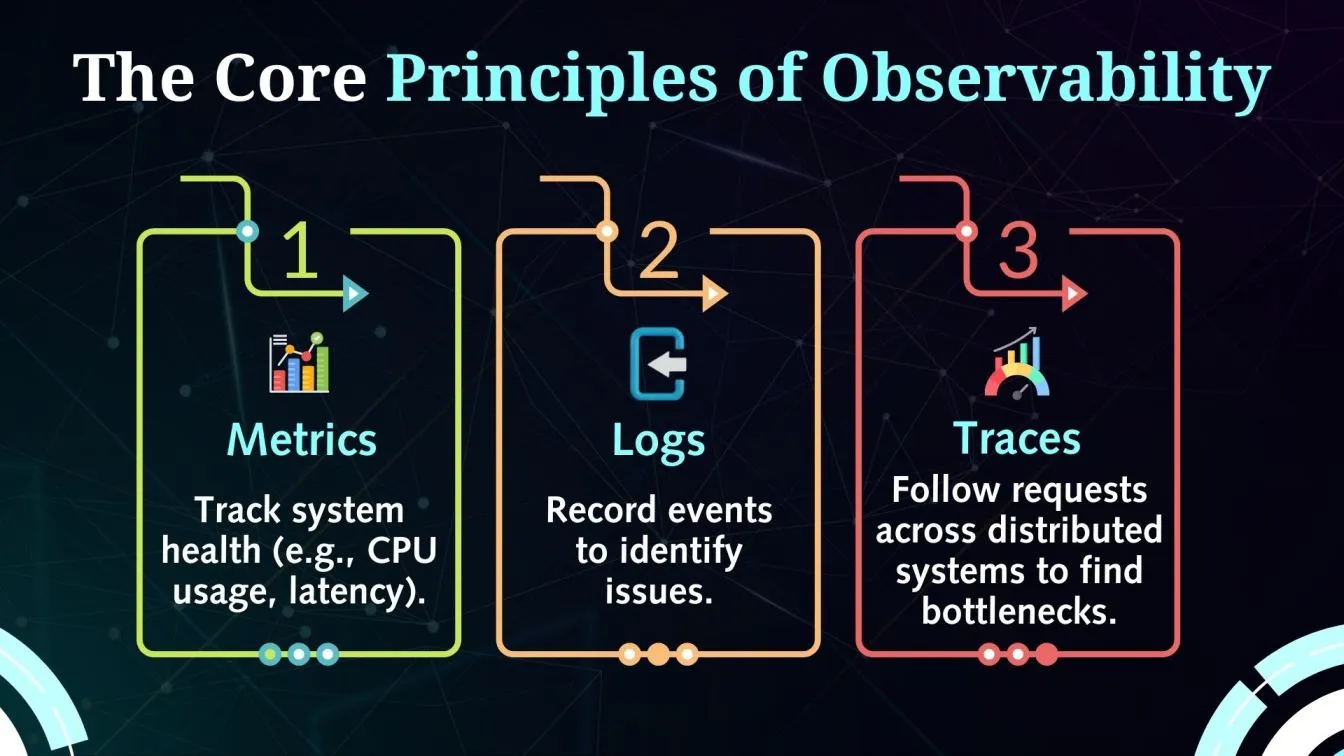
The Core Principles of Observability
Three fundamental pillars support observability and offer profound insights into system performance:
- Metrics: Quantitative data points like CPU usage and request latency, reflecting system health.
- Logs: Detailed event records that capture system operations, crucial for spotting anomalies and diagnosing issues.
- Traces: End-to-end tracking of requests across distributed systems, helping identify bottlenecks and debug microservices.
Together, these observability pillars provide a thorough understanding of the internal state of a system.
Observability is essential for managing microservices and cloud-native apps because it helps reveal hidden problems, whereas monitoring concentrates on identifying known errors.
Teams can minimize downtime, increase performance, and proactively discover root causes by combining analytics, logs, and traces.
Embracing observability tools ensures seamless operations and real-time insights, strengthening system resilience and boosting application reliability in dynamic environments.
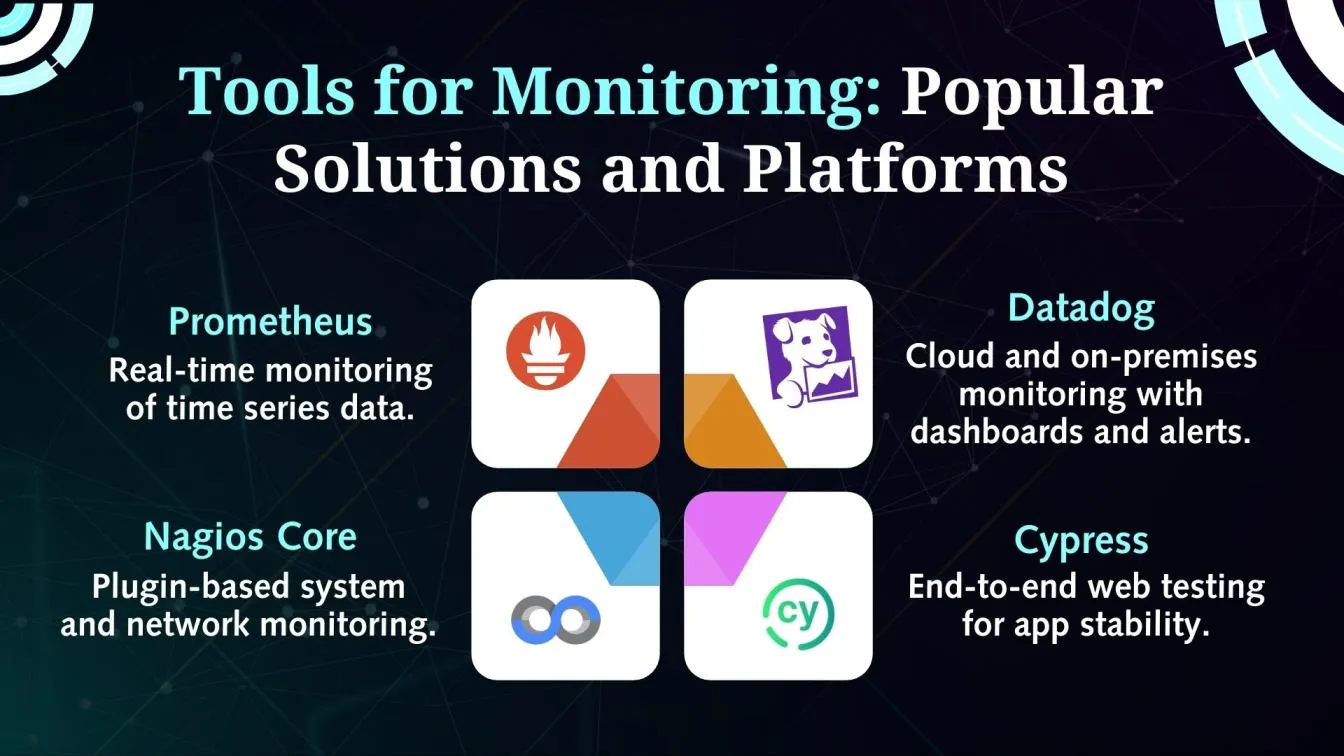
Tools for Monitoring: Popular Solutions and Platforms
Searching for trustworthy tools to keep an eye on system performance? The following are some of the best platforms and solutions for monitoring:
Prometheus: An effective open-source program for gathering time series data and monitoring in real time.
Datadog: Provides informative dashboards and alarms, making it perfect for monitoring on-premises and cloud infrastructure.
Nagios Core: An adaptable platform for network and system monitoring that is plugin-based.
Cypress web testing : It excels at end-to-end testing and automation for web applications, guaranteeing smooth user experiences and front-end stability.
These tools enable companies to improve dependability, maximize performance, and identify problems early. Investing in reliable monitoring solutions increases operational efficiency and reduces downtime, whether it is for watching server health, cloud resources, or app functionality. Use the appropriate monitoring technique to stay ahead!
Real-Time Insights: Observability Beyond Monitoring
Observability provides real-time insights into system behavior, going beyond standard monitoring. Instead of static dashboards, it provides dynamic, interactive views by analyzing data as it moves between cloud environments, infrastructure, and applications. Teams can swiftly identify, comprehend, and address performance problems with this method.
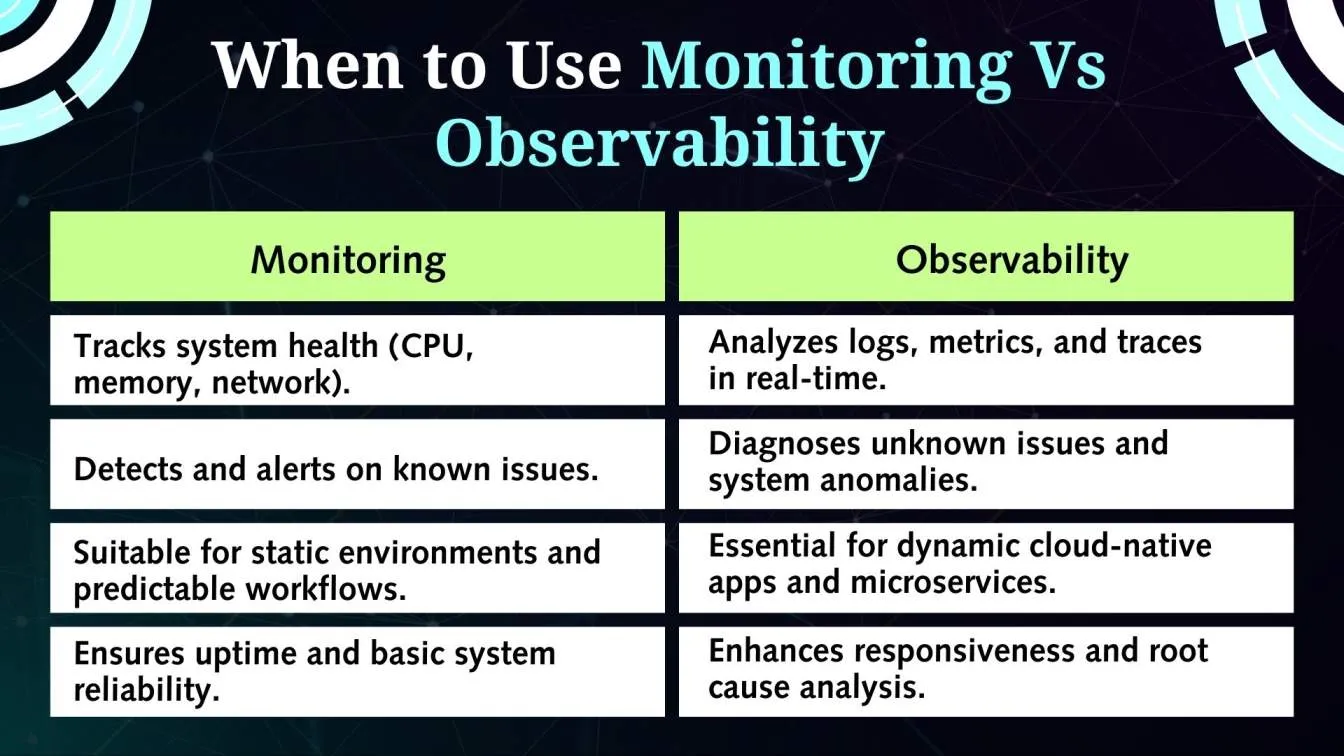
When to Use Monitoring vs. Observability
Monitoring:
- Ideal for static environments.
- Tracks uptime, CPU usage, memory, and network health.
- Identifies known issues with alerts and performance metrics.
- Ensures system stability and reliability.
Observability:
- Crucial for dynamic cloud-native apps and microservices.
- Analyzes real-time data — logs metrics, and traces.
- Uncovers unknown failures by diagnosing root causes.
- Optimizes system performance and responsiveness.
Combined Approach:
- Vital for cloud microservices management in hybrid contexts.
- Facilitates proactive incident management and smooth scaling.
- Increases operational effectiveness and system resilience.
- Detects hidden performance issues and aids in uptime maintenance.
Adopting both monitoring and observability strategies empowers businesses to stay ahead of disruptions and keep critical applications running smoothly.
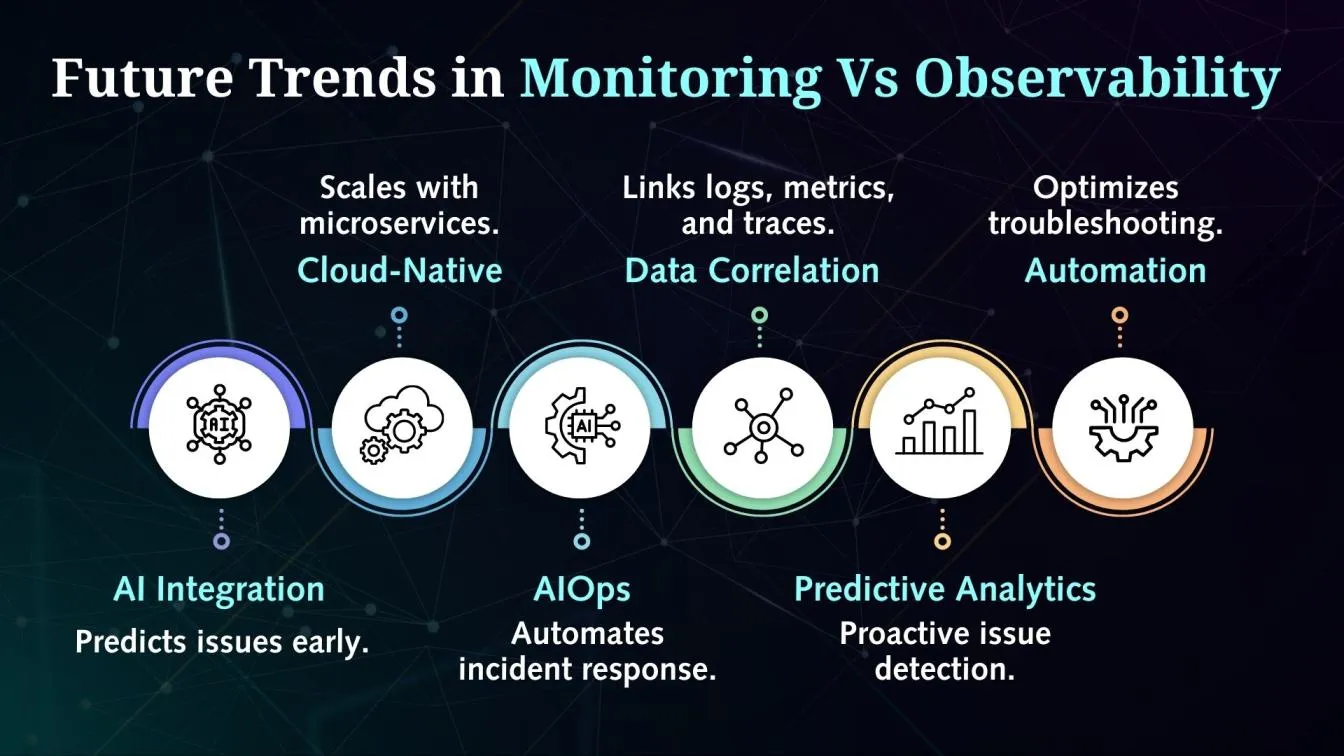
Future Trends in Monitoring vs. Observability
AI, automation, and cloud-native technologies are driving a rapid evolution in monitoring and observability in the future. While observability will delve further into root cause analysis with AI-powered insights, monitoring will go beyond static data tracking and employ predictive analytics to anticipate problems. Tools need to become more intelligent and flexible as microservices and dynamic systems expand in order to guarantee smooth operations.
Key Trends:
- AI Integration: Predicts system issues before they happen.
- Advanced Observability: Uses AI for real-time root cause analysis.
- Cloud-Native Focus: Enhances scalability for microservices.
- AIOps: Automates incident response, reducing downtime.
- Data Correlation: Combines logs, metrics, and traces for deeper insights.
- Predictive Analytics: Shifts from reactive to proactive system management.
- Automation: Streamlines troubleshooting and performance optimization.
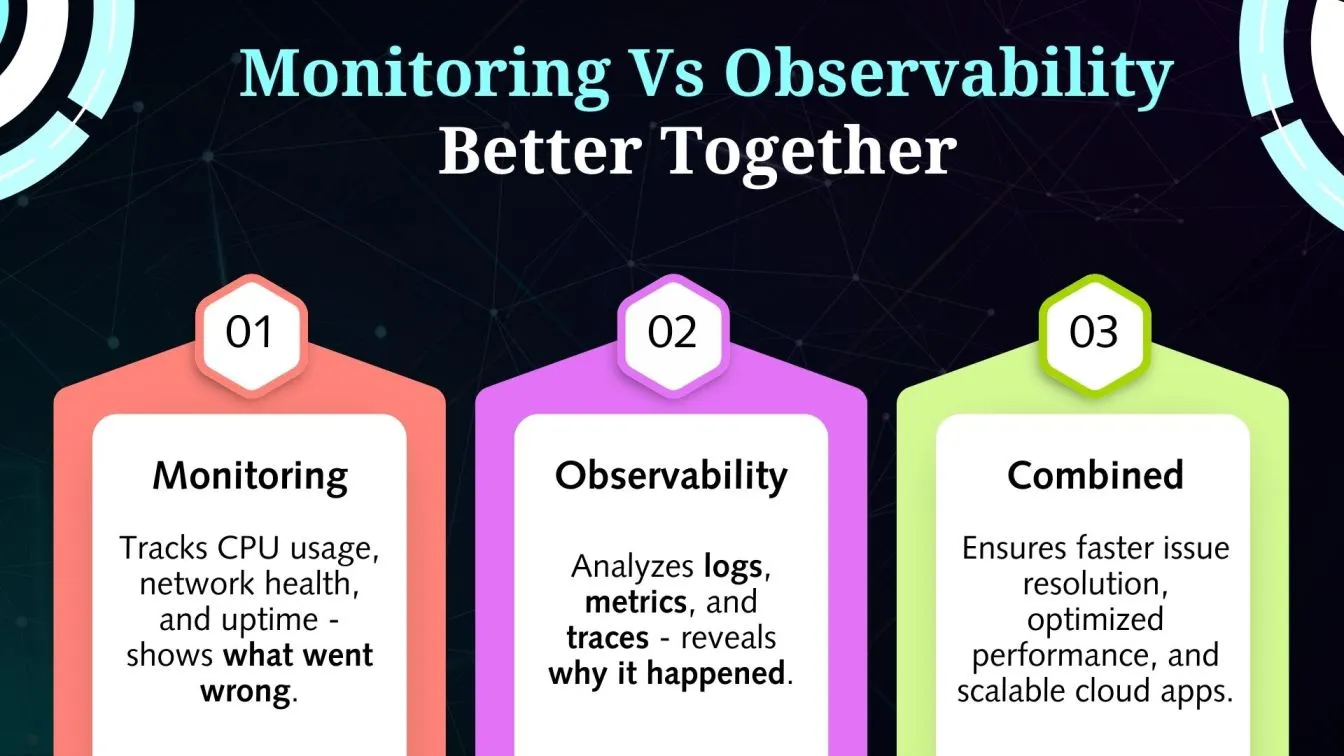
Combining Monitoring and Observability for Optimal System Performance
Observability and monitoring work best together in modern systems rather than depending just on one. Monitoring helps teams react swiftly to known problems by providing real-time notifications for CPU utilization, network health, and uptime. Conversely, observability goes farther, examining logs, metrics, and traces to find hidden issues and identify the underlying causes, which is crucial for microservices and cloud-native apps.
Together, these tactics offer a thorough understanding of system health. While observability explains why something happened, monitoring identifies what went wrong. Particularly for dynamic cloud systems, this synergy improves performance optimization, proactive problem management, and smooth scalability.
Employing both observability and monitoring solutions helps businesses keep ahead of possible interruptions, improve operational efficiency, and decrease downtime. Businesses that adopt this dual strategy make sure their cloud monitoring services software runs dependable and robustly, fostering innovation and expansion.
Conclusion: Choosing the Right Approach for Your Application
Comprehensive monitoring and observability play a vital role in managing modern applications by ensuring comprehensive data collection and proactive issue detection. While simple monitoring focuses on predefined performance indicators, observability goes beyond by uncovering failure modes, performance bottlenecks, and potential bottlenecks. DevOps monitoring and monitoring systems work hand-in-hand to provide effective monitoring of complex environments, offering comprehensive insights and detailed insights into key metrics and critical metrics. Application performance monitoring and resource allocation strategies use a holistic approach to optimize operational costs. Understanding observability vs. monitoring helps DevOps environments adopt a comprehensive approach, ensuring quick response to emerging issues. By leveraging both practices, teams can gain a deeper understanding of internal processes, leading to streamlined performance and a balanced approach to managing modern IT infrastructures.
People also asked
Which montoring tool is best ?
The best monitoring tool depends on your needs: Prometheus for cloud-native metrics, Datadog for full-stack observability, and Nagios for network monitoring — all ensuring reliable system performance.
What is kpl in observability ?
In observability, KPL (Kinesis Producer Library) is used to efficiently collect and send large volumes of event data to Amazon Kinesis Data Streams for real-time monitoring and analysis.
what is the diffrence between monitoring plan and monitoring framework ?
A monitoring plan outlines specific goals, metrics, and processes for tracking system performance, while a monitoring framework is the overall structure, tools, and methods used to implement monitoring.
what are the three types of machine learning model monitoring ?
The three types of machine learning model monitoring are:
- Data Drift Monitoring — Tracks changes in input data distribution.
- Model Performance Monitoring — Measures accuracy and error rates.
- Concept Drift Monitoring — Detects shifts in the relationship between input and output.
what is the difference between monitoring and screening ?
Monitoring is ongoing observation to track performance or detect changes, while screening is a one-time or periodic check to identify issues or risks early on.
%201.webp)