JMeter, an open-source load testing tool, is widely used for performance testing and load testing of applications. It's reasonably straightforward to use, strong, and adaptable. But it has its fair share of common problems, just like other programs. We'll examine these problems and offer workarounds in this tutorial to help you solve them. Let us see what we are going to learn in this blog:
What is JMeter and why is it used?: Gain insights into JMeter's role in testing
📌 Errors encountered while working with JMeter and solution: Identify common errors in JMeter usage
📌 Enhancing JMeter Performance: Optimize JMeter for peak performance
📌 Top Troubleshooting Tips for JMeter: Navigate common JMeter challenges effortlessly
📌 Best practices for error-free testing in JMeter: Ensure flawless testing with proven methods
📌 Further Resources for JMeter and Performance Testing: Expand your JMeter expertise with additional resources
What is JMeter and Why is it Used?
Apache JMeter is a Java-based desktop application that is used to load test functional behavior and gauge performance. It tests the resilience of servers, networks, or objects, or examines overall performance under various stress scenarios by simulating intense demands on them. It's commonly used for web application testing, but it can also be used for other protocols like FTP, LDAP, JDBC, SOAP, JMS, and more.
JMeter is widely employed for stress testing, allowing testers to evaluate an application's stability and performance under extreme load conditions.
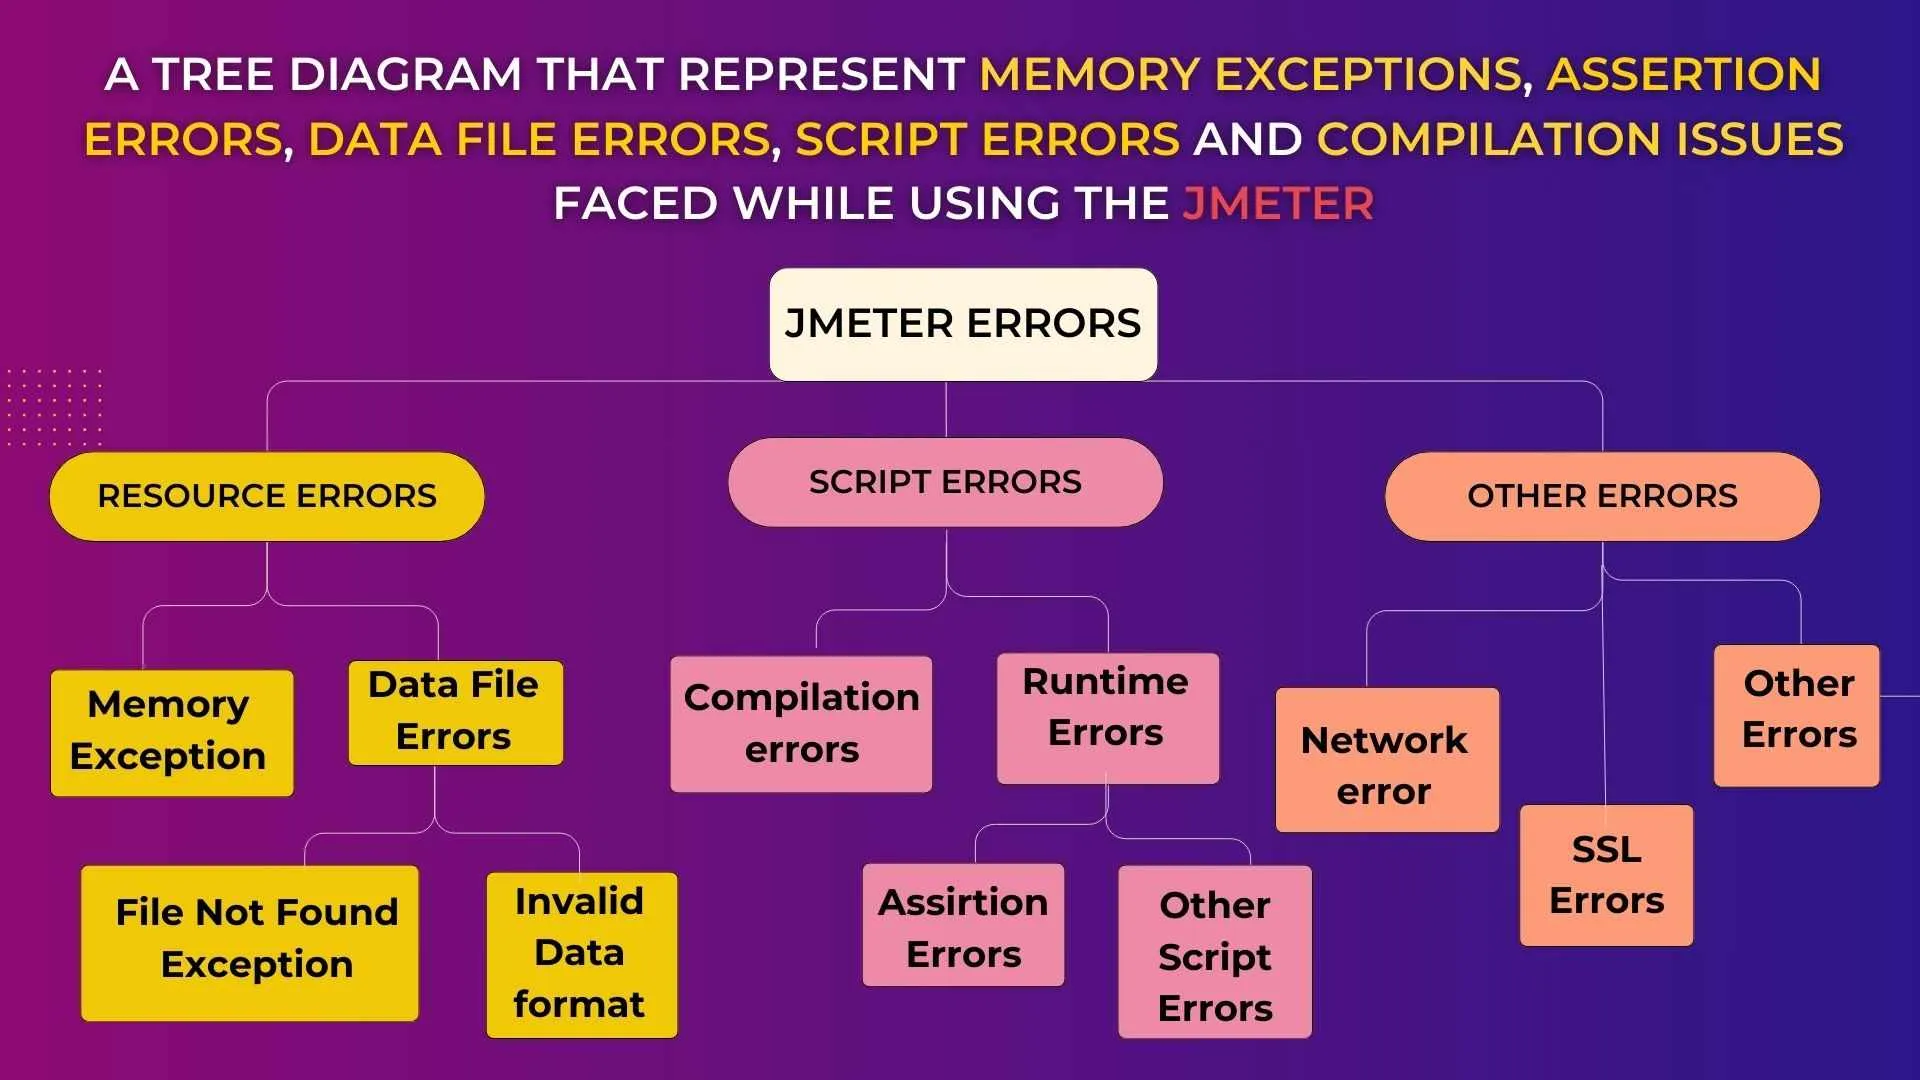
Memory Exception
When JMeter uses up all of the Java heap space allotted, out-of-memory errors happen, which can cause crashes or test failures. When conducting tests with big datasets or high concurrency levels, this problem frequently occurs.

An error notice that appears like the following could appear to you:
java.lang.OutOfMemoryError: Java heap spaceThese kinds of error codes point to memory-related problems that require attention.
To fix:
- Expand heap space: Use the `-Xmx} option in the `jmeter.bat` (Windows) or `jmeter.sh` (Unix-based systems) file to tell JMeter to use additional memory. Increasing the value of {-Xmx} can aid in reducing out-of-memory errors.
- Example
set HEAP=-Xms512m -Xmx512mOptimize test plans: To cut down on memory utilization, simplify test plans. This entails optimizing resource-intensive components like assertions and post-processors, reducing the number of concurrent users, and minimizing the use of listeners.
SSL Handshake Errors
SSL handshake errors happen when JMeter is unable to connect securely to the server, usually because of problems with certificates.
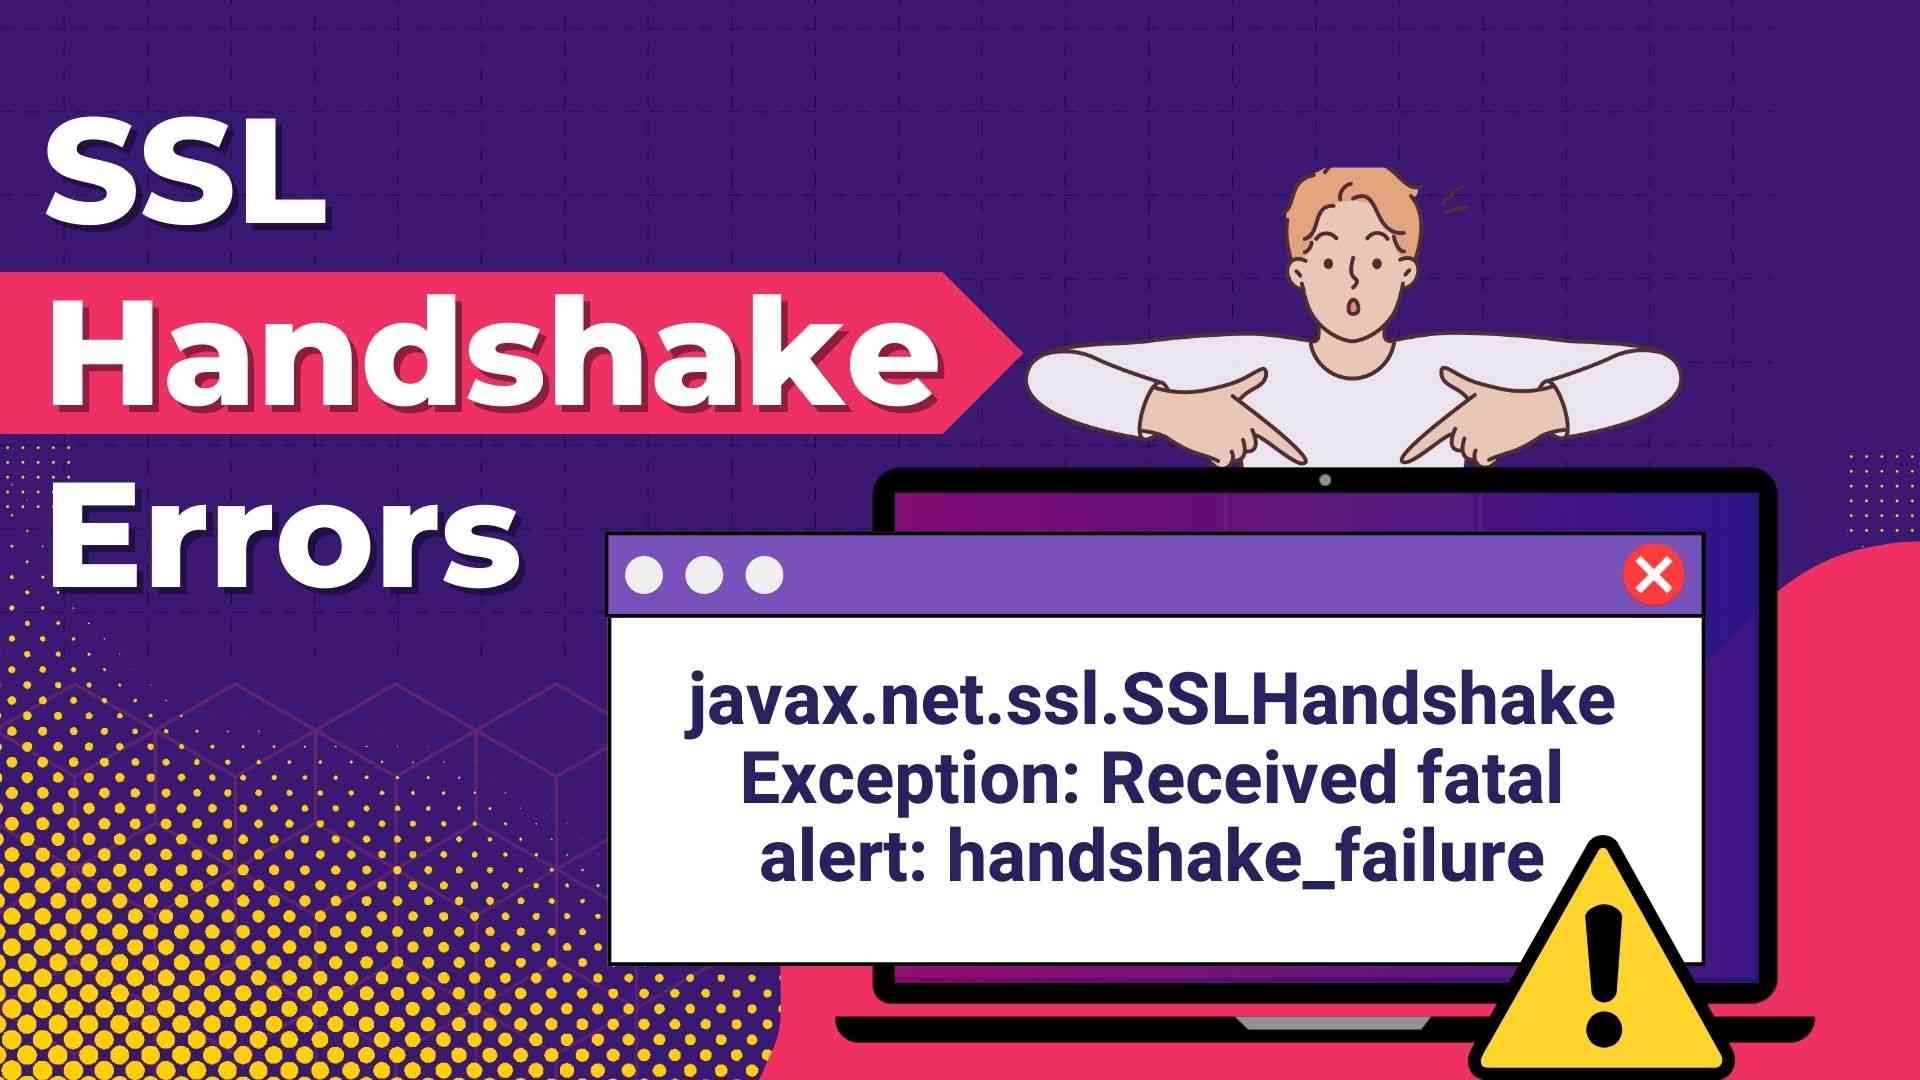
An error notice that appears like the following could appear to you.
javax.net.ssl.SSLHandshakeException: Received fatal alert: handshake_failureTo fix
- Check server certificates: Make that the JMeter instance recognizes and trusts the server's SSL/TLS certificates. If required, import the server's certificate into the trust store of JMeter.
keytool -import -alias mycert -keystore jmeter/bin/mykeystore.jks -file server.crt- Verify protocol interoperability: Verify that JMeter's Java version supports the SSL/TLS protocol version that the server is using. If necessary, update Java to support updated protocol versions.
Example:
javax.net.ssl.keyStore=bin/mykeystore.jks
javax.net.ssl.keyStorePassword=changeit
Connection Refused Errors
Errors such as Proxy Settings mean that JMeter cannot connect to the server. Numerous factors, including firewall restrictions, server unavailability, and network issues, may cause this.
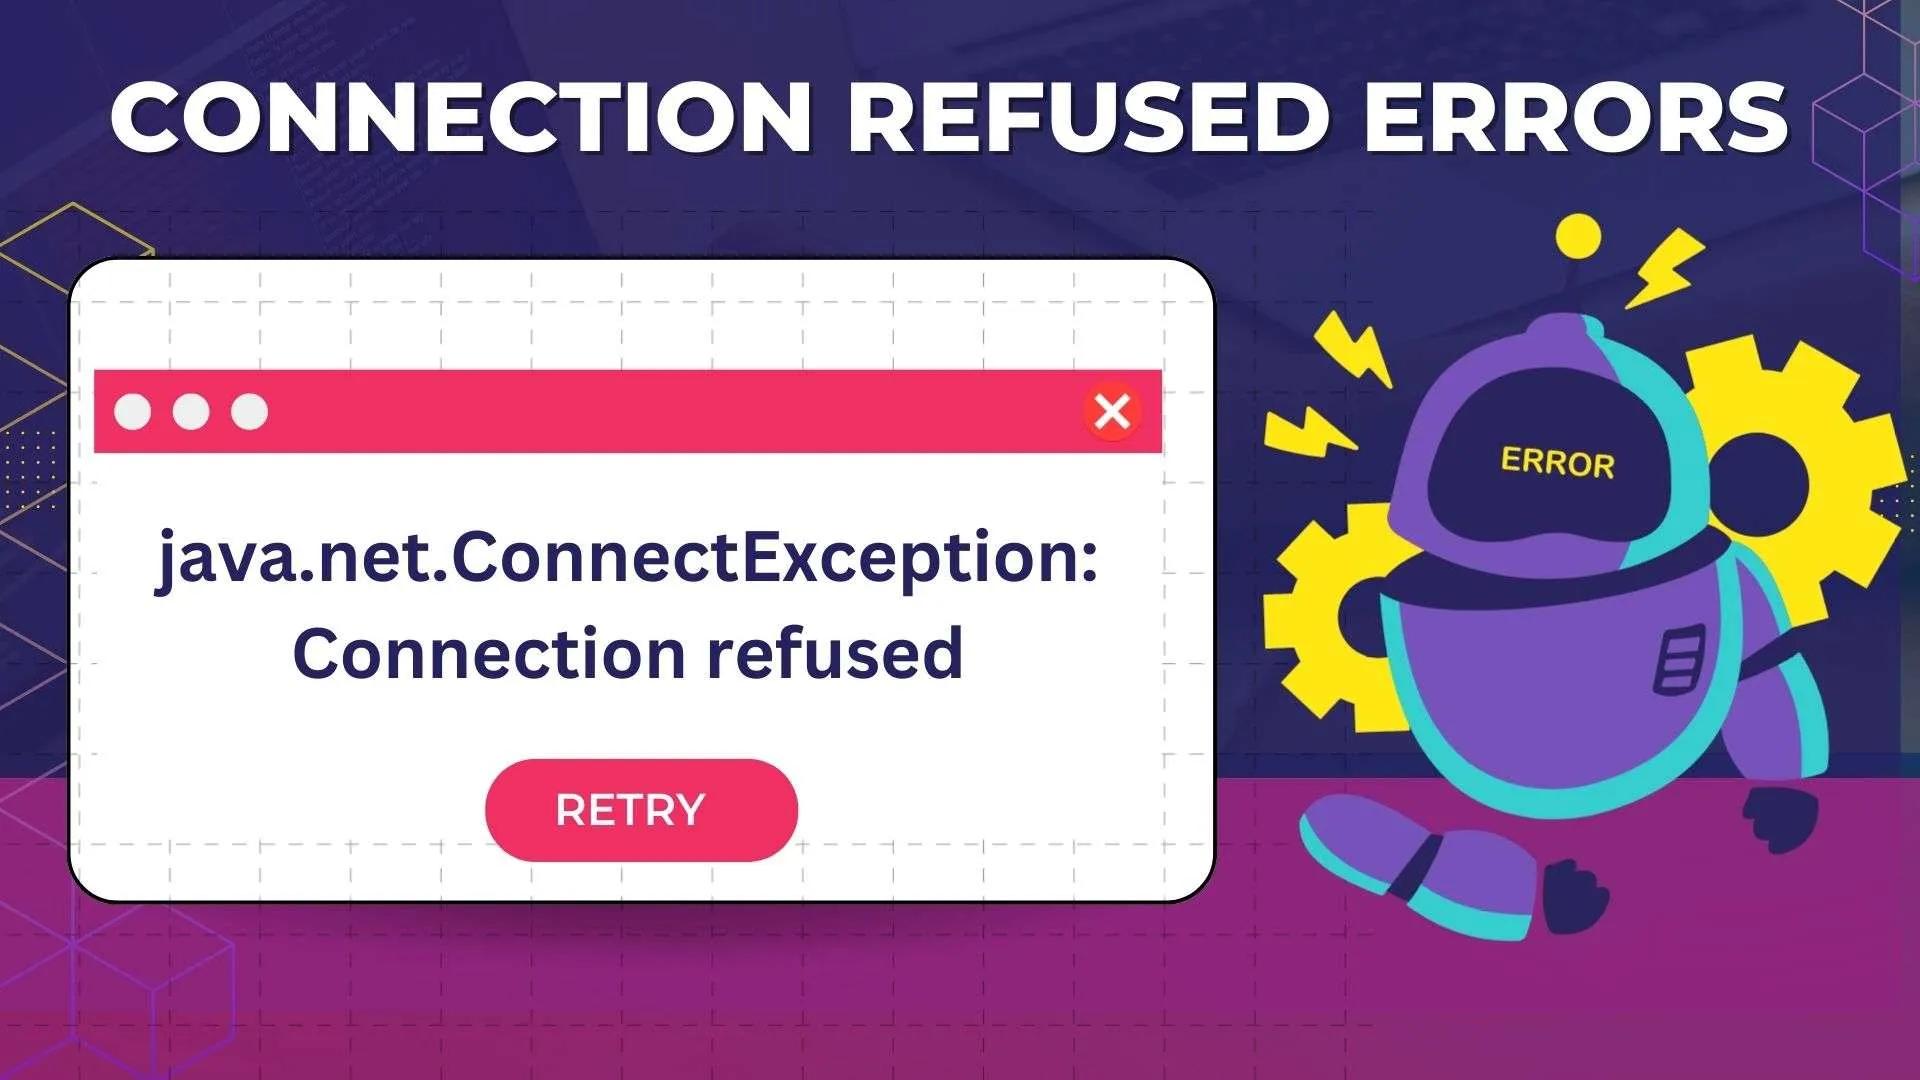
An error notice that appears like the following could appear to you.
java.net.ConnectException: Connection refusedTo fix:
- Verify the server's availability by making sure the JMeter instance can connect to and contact the server. Check network connectivity and the status of the servers.
- Examine the firewall's settings: Verify firewall settings to make sure JMeter traffic is not prohibited. If required, modify firewall rules to permit connectivity with the server.
- Utilizing logic controllers effectively in test plans can enhance the organization and efficiency of test scenarios, ensuring smoother execution and more accurate results.
httpclient4.retrycount=1
httpclient4.request_sent_retry_enabled=true
httpclient4.idletimeout=5000
Script Compilation Issues
When JMete detects errors during the parsing or execution of test scripts, script compilation issues arise. Syntax mistakes, missing dependencies, or conflicting script versions can all cause these issues.
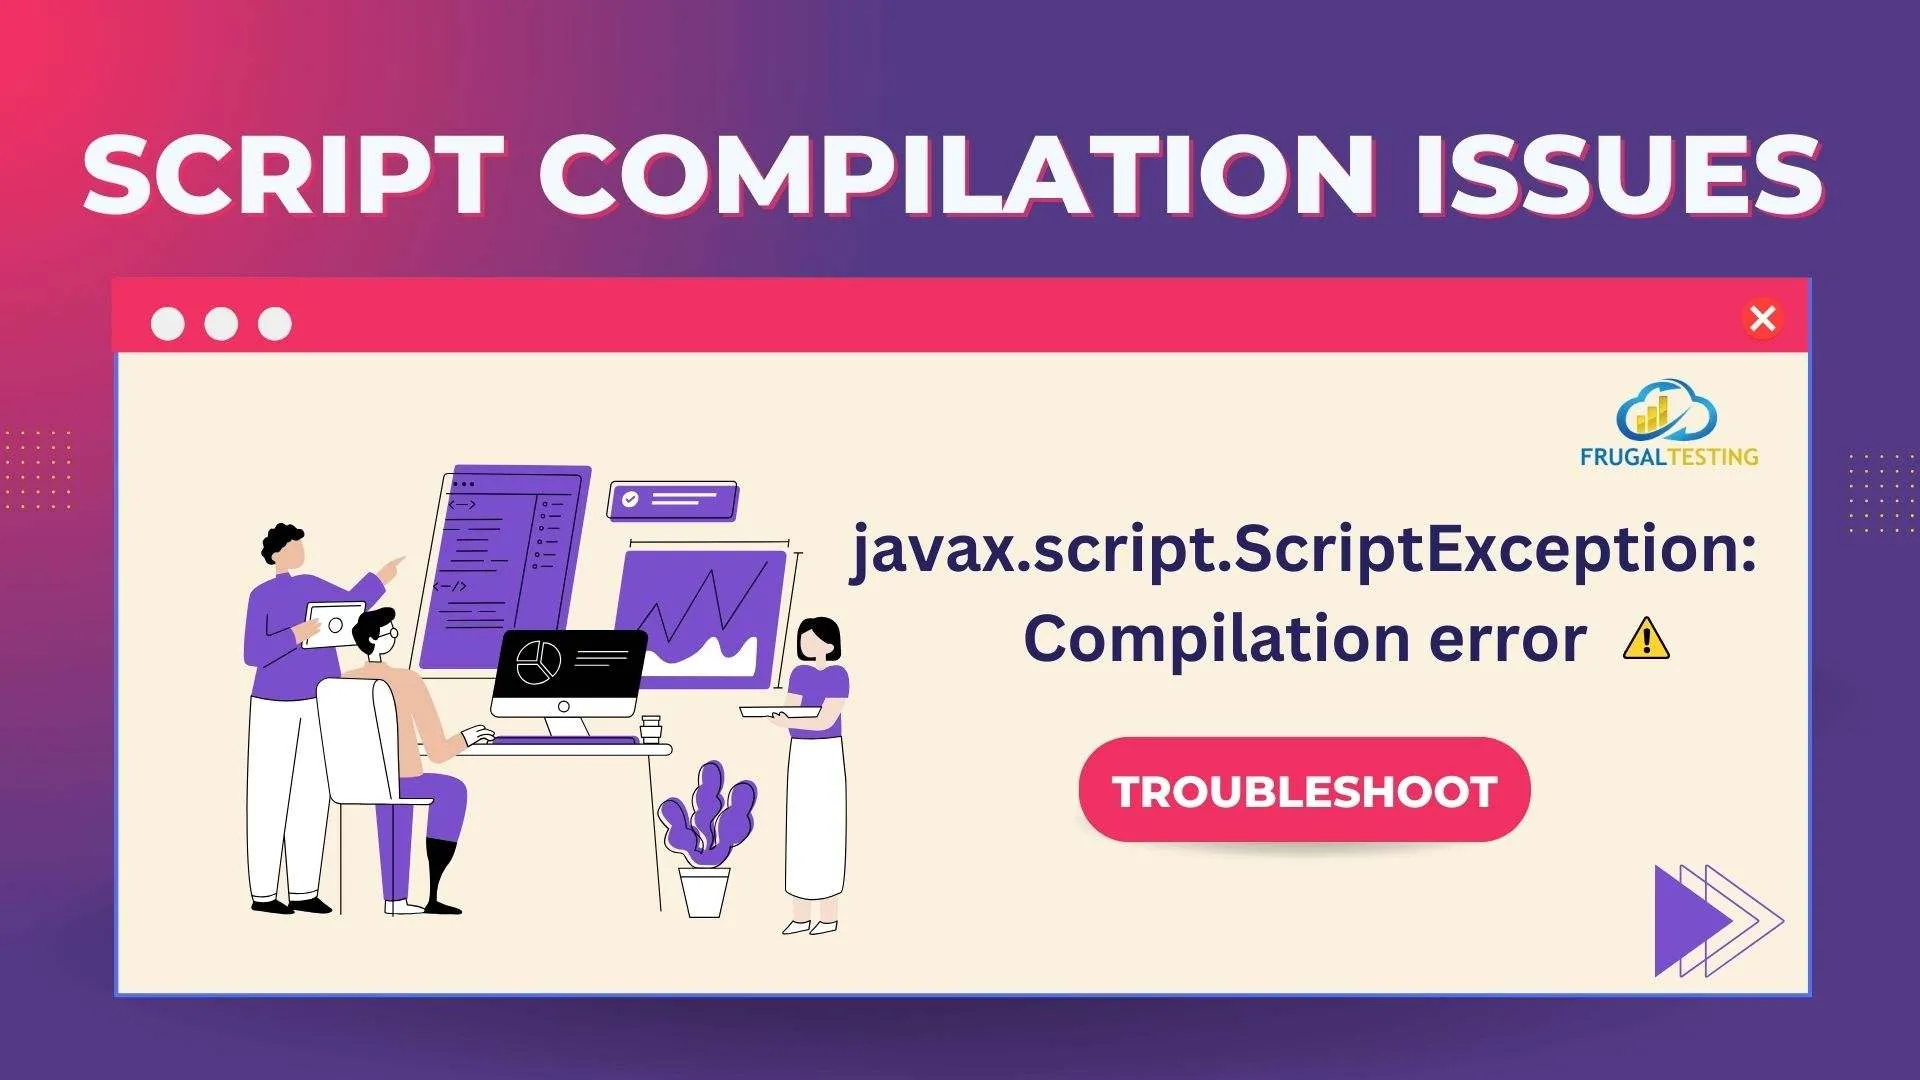
An error notice that appears like the following could appear to you.
javax.script.ScriptException: Compilation errorTo fix:
- Examine the grammar of the scripting language: Check them twice for typos or syntax issues. Make sure that every script dependency is available and correctly referenced. To run intricate scripts and alter JMeter behavior to suit your needs, use the Groovy scripting engine.
- Debugging scripts: Use the debugging tools that JMeter comes with to find and fix faults related to script compilation. Trace the script's execution step by step to identify the problem's origin.
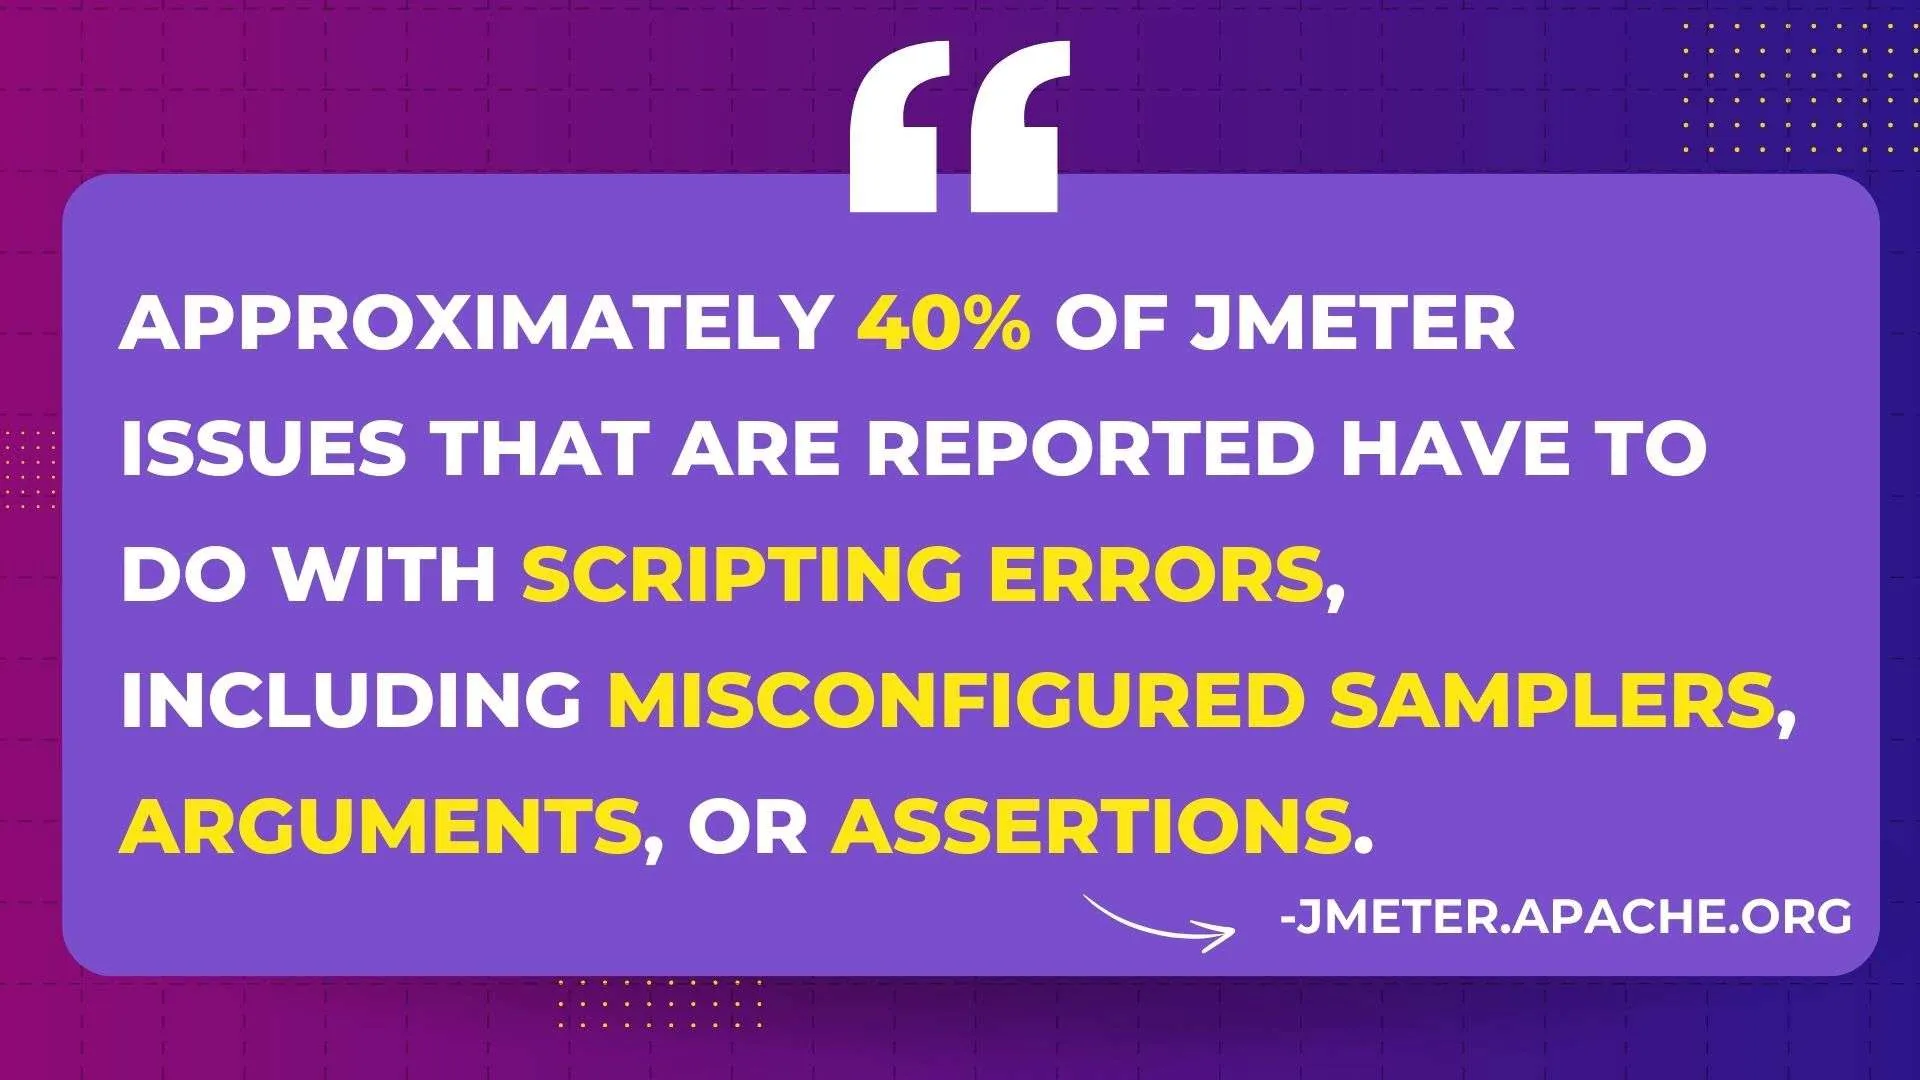
Assertion Errors
When JMeter detects errors during the parsing or execution of test scripts, script compilation issues arise. Syntax mistakes, missing dependencies, or conflicting script versions can all cause these issues.
To fix
- Review configuration: Make sure your assertion components appropriately reflect the intended behavior of the tested component by checking their settings.
- Adjust criteria and Debug: If necessary, adjust the assertion criteria. Then, debug by identifying the problem's cause, examining the server-side setup, and seeking help from resources like documentation or community forums.
Thread Group Errors
Misconfigured thread settings can result in thread group faults, which can cause problems like unequal load distribution or excessive resource consumption.
To fix
- Examine the thread group settings: Verify the thread count, ramp-up time, and loop counts for each thread group setup. Adapt the settings according to the server's capabilities and the test goals.
- Keep an eye on resource utilization: Throughout the test execution process, keep an eye on resource usage to spot any anomalies or bottlenecks. To maximize resource usage, modify the thread group configuration.
Data File Issues
When JMeter runs into problems reading or processing data files—like parameterization-related CSV files—data file issues arise.

An error notice that appears like the following could appear to you.
java.io.FileNotFoundException: testdata.csv (No such file or directory)To fix
- Verify the format of data files to make sure they are accurate and include valid data. Look for any inconsistent or incorrect formatting.
- Check file locations: Verify that the file paths provided in JMeter test elements lead to the right location of the data files by checking them twice. If required, update the file paths.
- Using additional files in JMeter guarantees precise handling of session data and preserves state consistency between requests when handling problems with data files or managing HTTP cookies during test execution.
Memory Errors
Memory management-related problems fall under the umbrella of memory errors, which also include heap fragmentation, memory leaks, and out-of-memory errors.
To fix:
- Track memory utilization: To keep tabs on memory usage during test execution, use JMeter's monitoring tools or third-party monitoring software. Look for any anomalies or spikes that might point to memory-related problems.
- Optimize memory allocation: If more memory is needed, change the JVM's parameters to give JMeter more. To increase memory efficiency, use memory optimization strategies like garbage collection tuning.
Server Resource Constraint Errors
When the server being tested is unable to manage the demand created by JMeter, a server resource constraint error occurs.
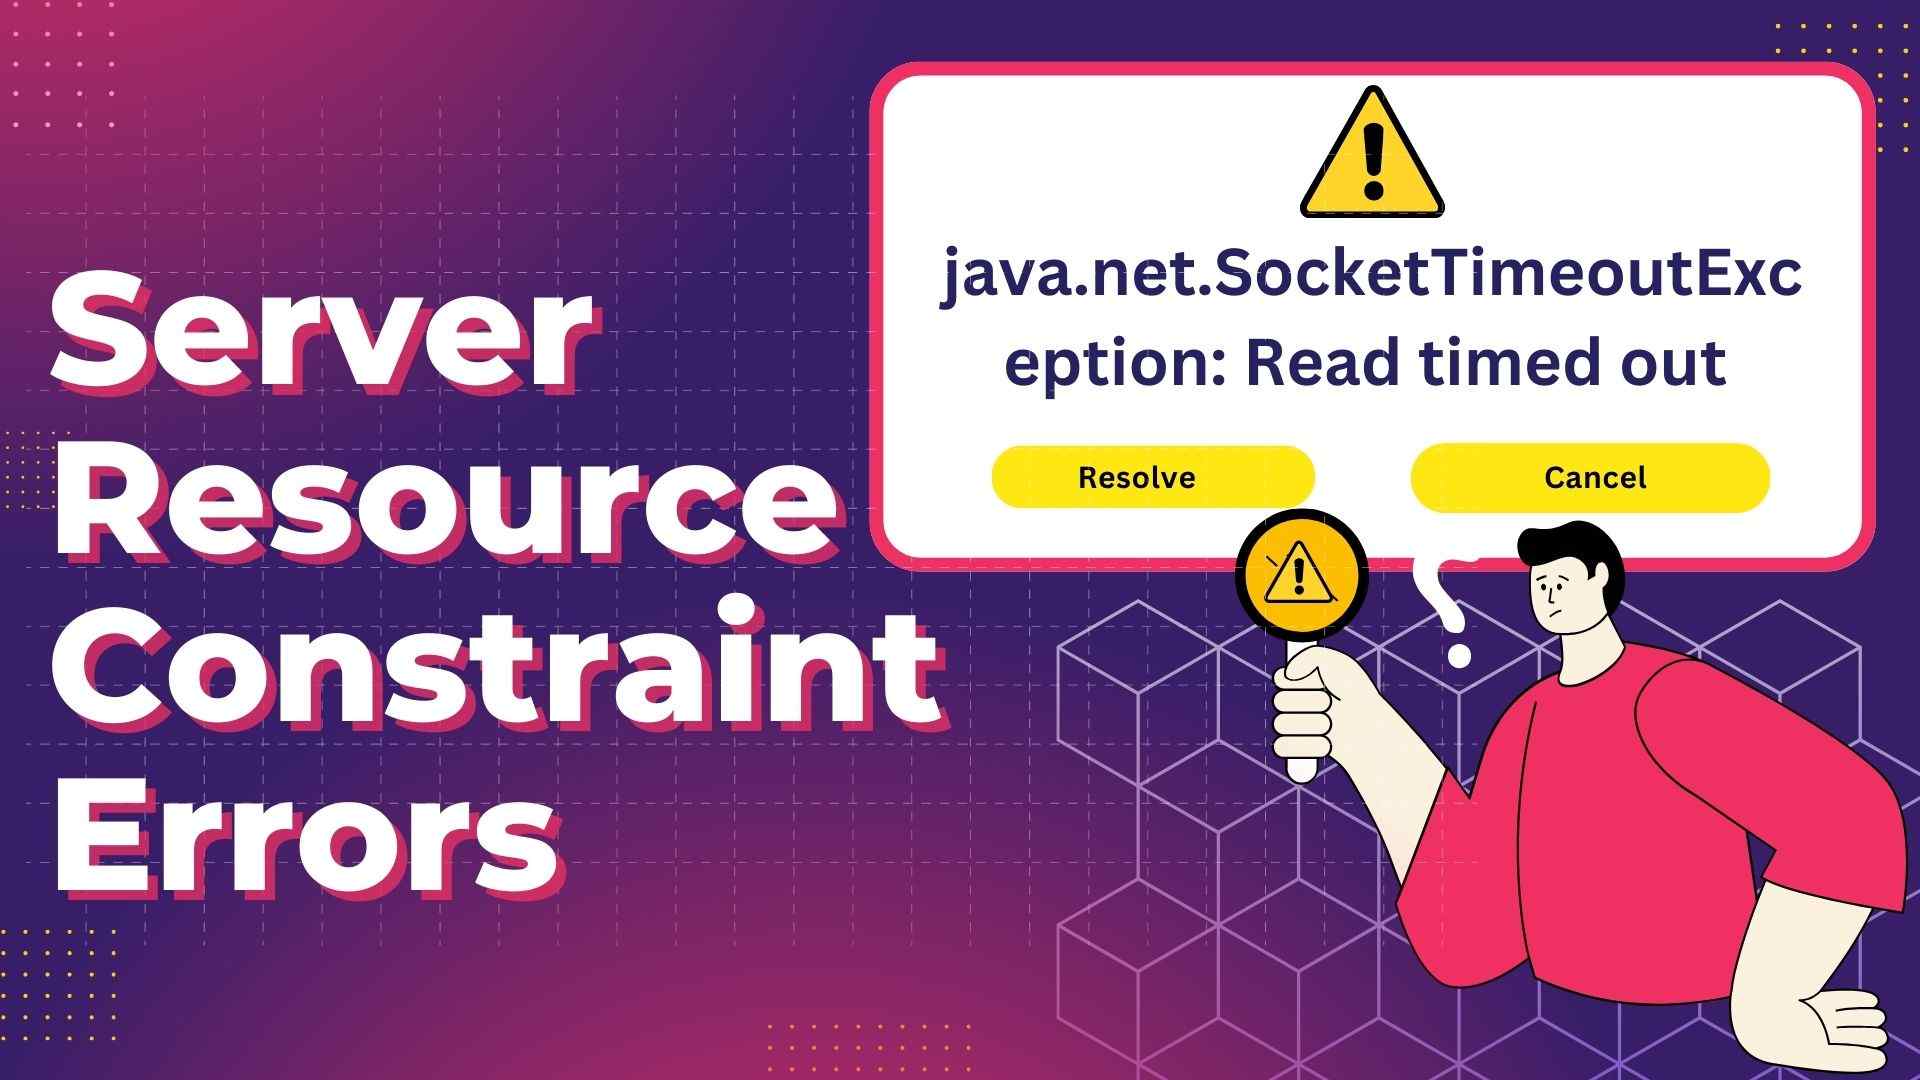
An error notice that appears like the following could appear to you.
java.net.SocketTimeoutException: Read timed outTo fix:
- Scale server resources: Add extra CPU cores, RAM, or disk space to the server to expand its capacity. If necessary, switch to a more potent hosting environment or upgrade the server hardware.
- Distribute load: To ease the burden on individual servers, distribute the load among a number of servers or instances. To efficiently distribute load, make use of JMeter's distributed testing features.
Thread Group Configuration Errors
Errors in thread group configuration result from incorrectly specified thread settings, which can cause problems like uneven workload distribution or excessively high concurrency levels.

An error notice that appears like the following could appear to you.
Thread Group: Number of Threads (users) must be greater than 0.To fix:
- Verify thread settings: Examine thread group setups to make sure the workload and concurrency levels are appropriately reflected. Adapt the settings according to the server's capabilities and the test goals.
- Perform testing for scalability: By progressively increasing the number of concurrent users and keeping an eye on system performance, you may test the application's scalability. Determine any limits on scalability and take appropriate action.
CSV Data Set Config Errors
When JMeter has trouble reading or processing the CSV files required for parameterization, it can result in CSV data set configuration problems.
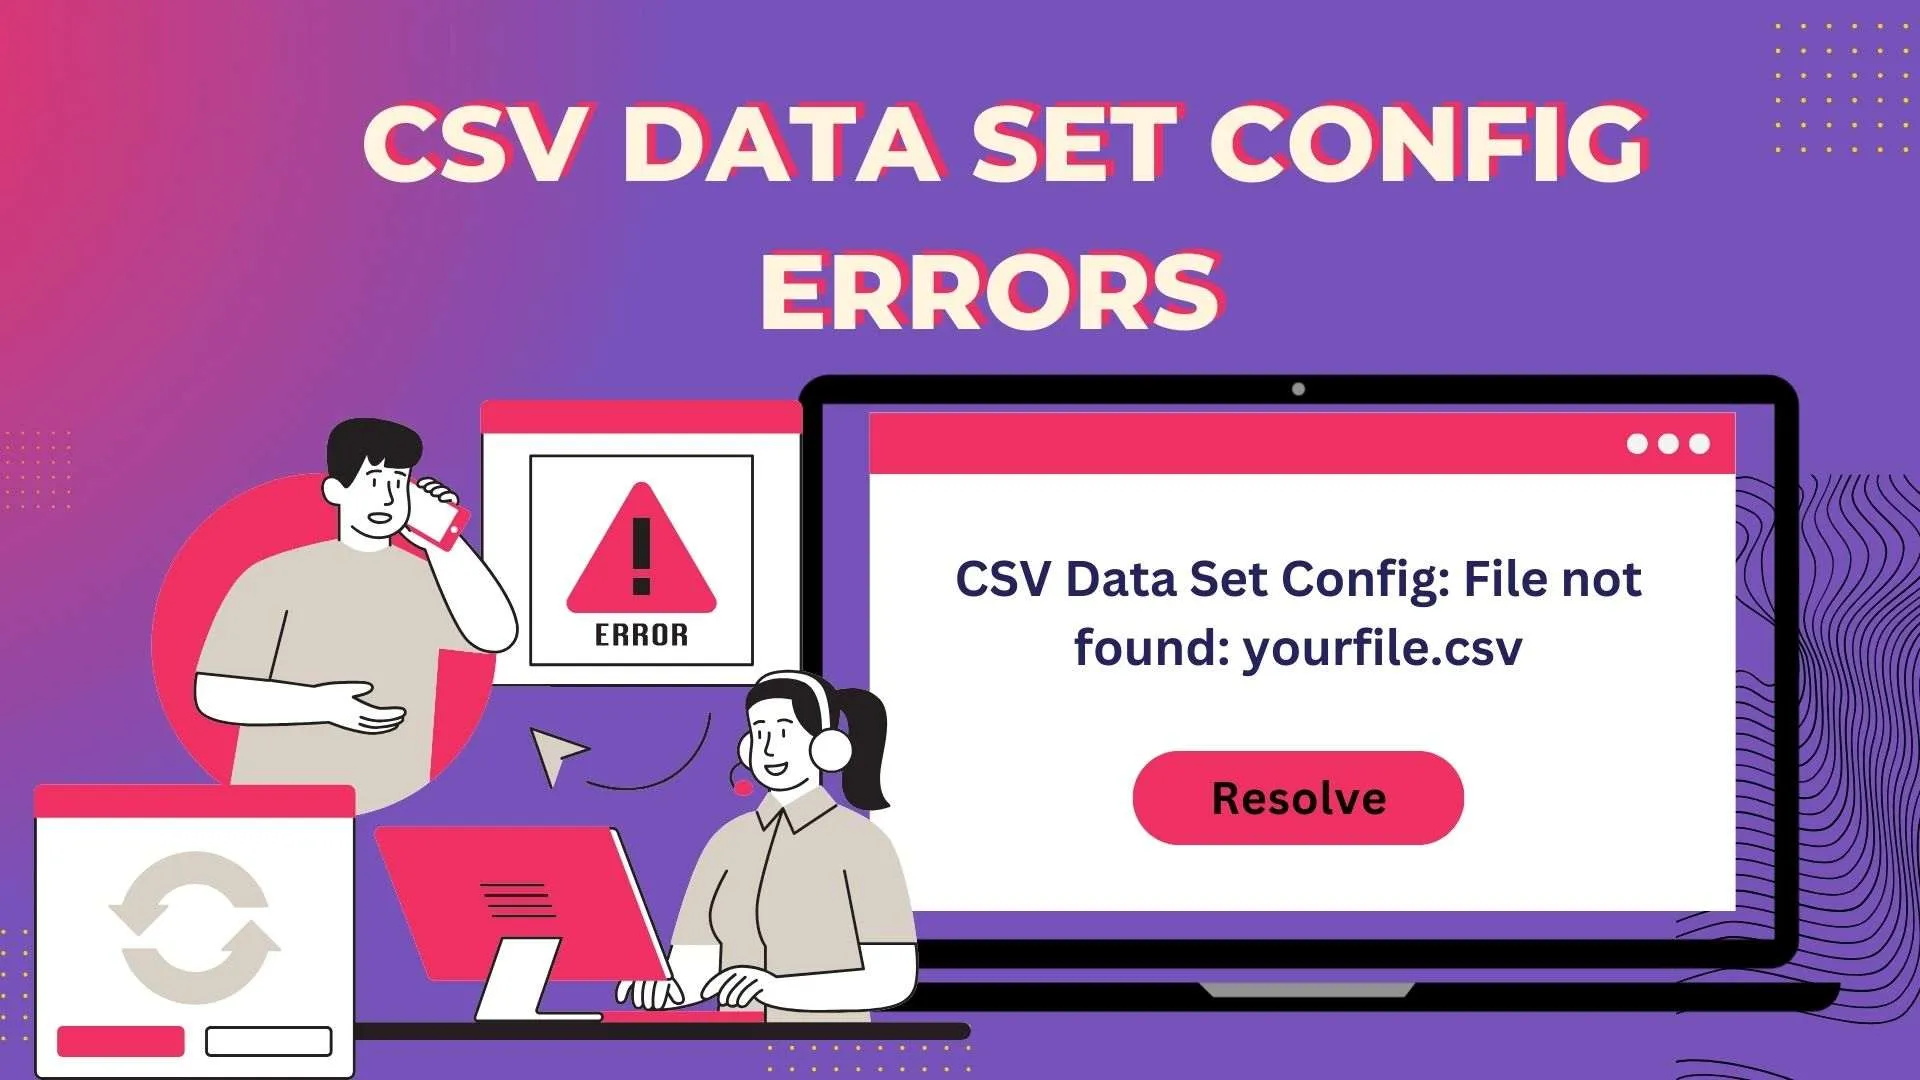
An error notice that appears like the following could appear to you.
CSV Data Set Config: File not found: yourfile.csvTo fix:
- Verify the format of CSV files to make sure they follow the desired structure and are formatted correctly. Look for any missing information or syntactic mistakes.
- Check the delimiter settings: Make that the delimiter settings in the CSV Data Set Config element correspond to the delimiter that is actually used in the CSV file by double-checking them. If required, adjust the delimiter settings.
RegEx Function Script Errors
RegEx function script failures happen when there are problems with JMeter's regular expression function execution in test scripts.
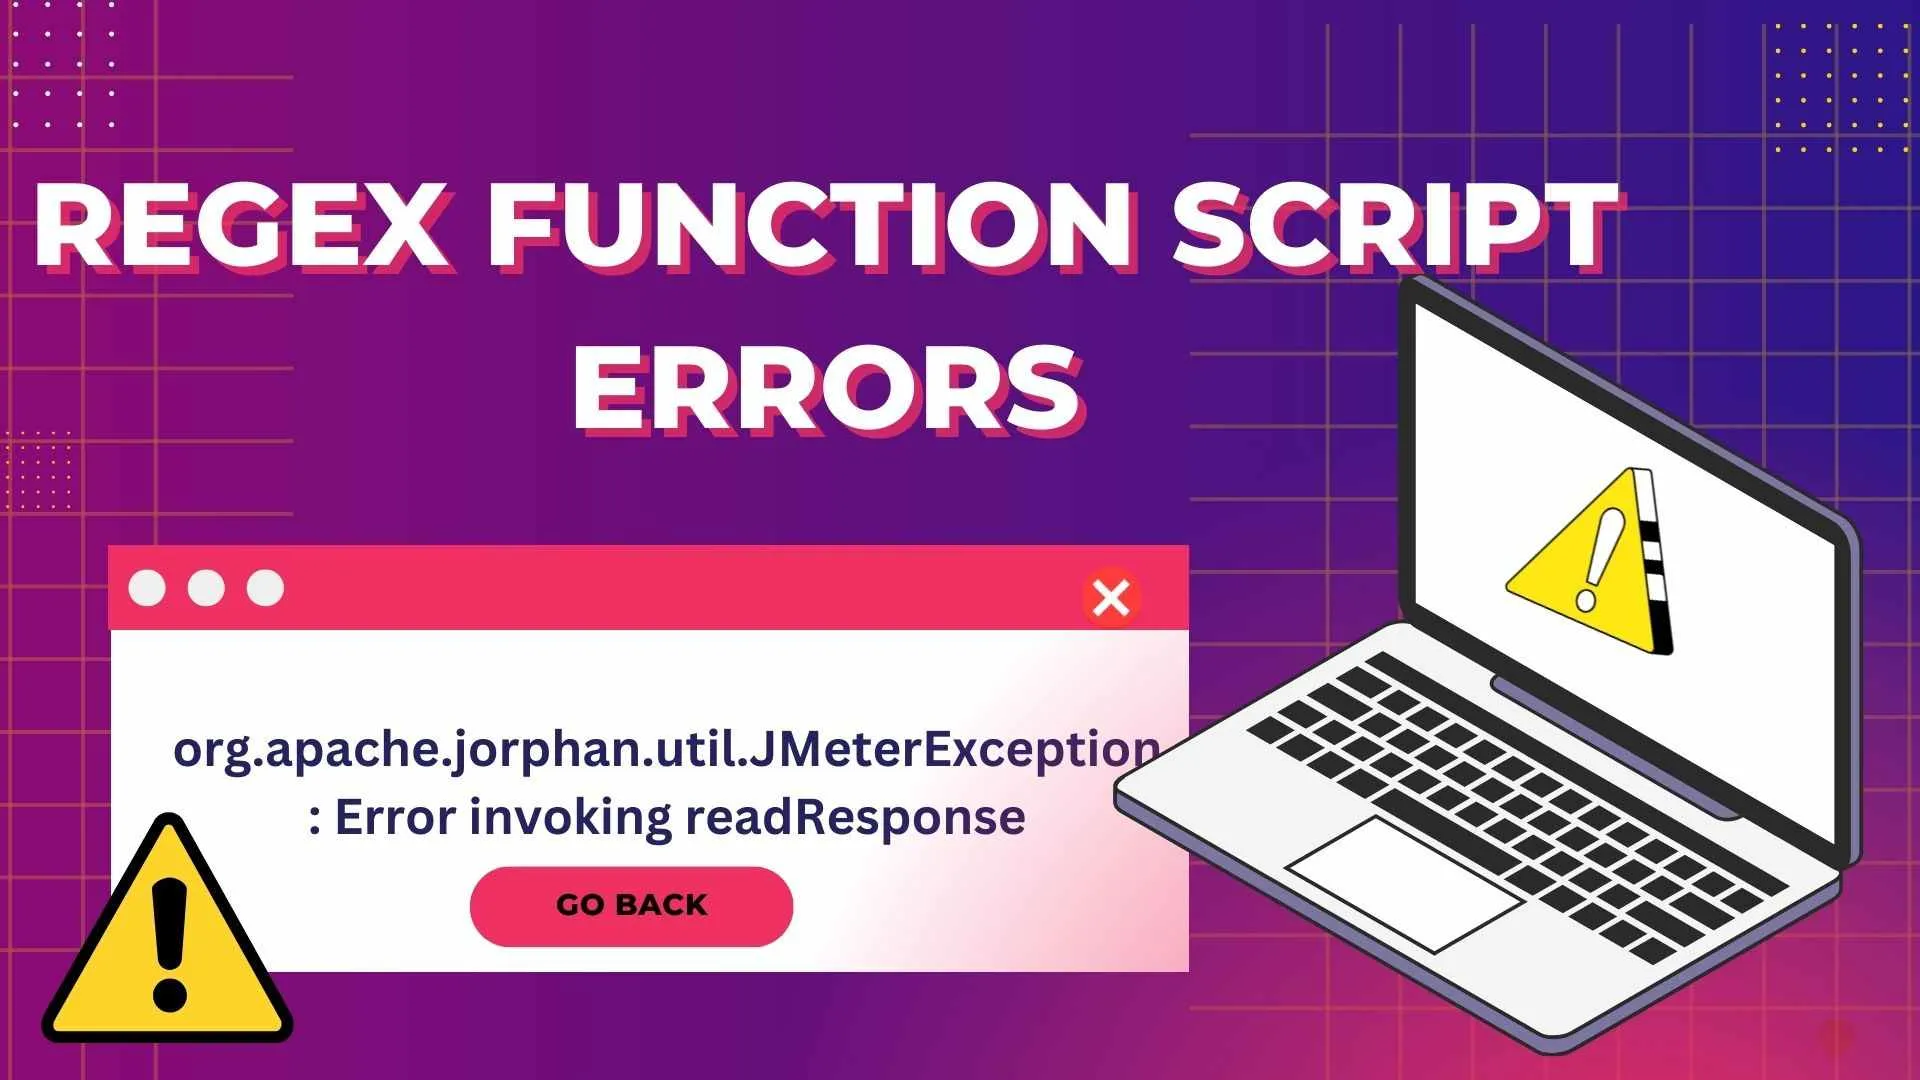
An error notice that appears like the following could appear to you.
org.apache.jorphan.util.JMeterException: Error invoking readResponse:To fix:
- Examine RegEx syntax: Verify that regular expressions used in test scripts are legitimate and formatted correctly by looking up their syntax. To validate expressions, use debugging tools or online RegEx testers.
- Debugging script execution: Examine each step of the script's execution to find any mistakes or inconsistent use of RegEx functions. Make sure that the appropriate RegEx functions are being used to extract the needed data from server responses.
XPath Extractor Script Errors
When JMeter runs into problems when processing XPath expressions in test scripts, the result is XPath extractor script errors.
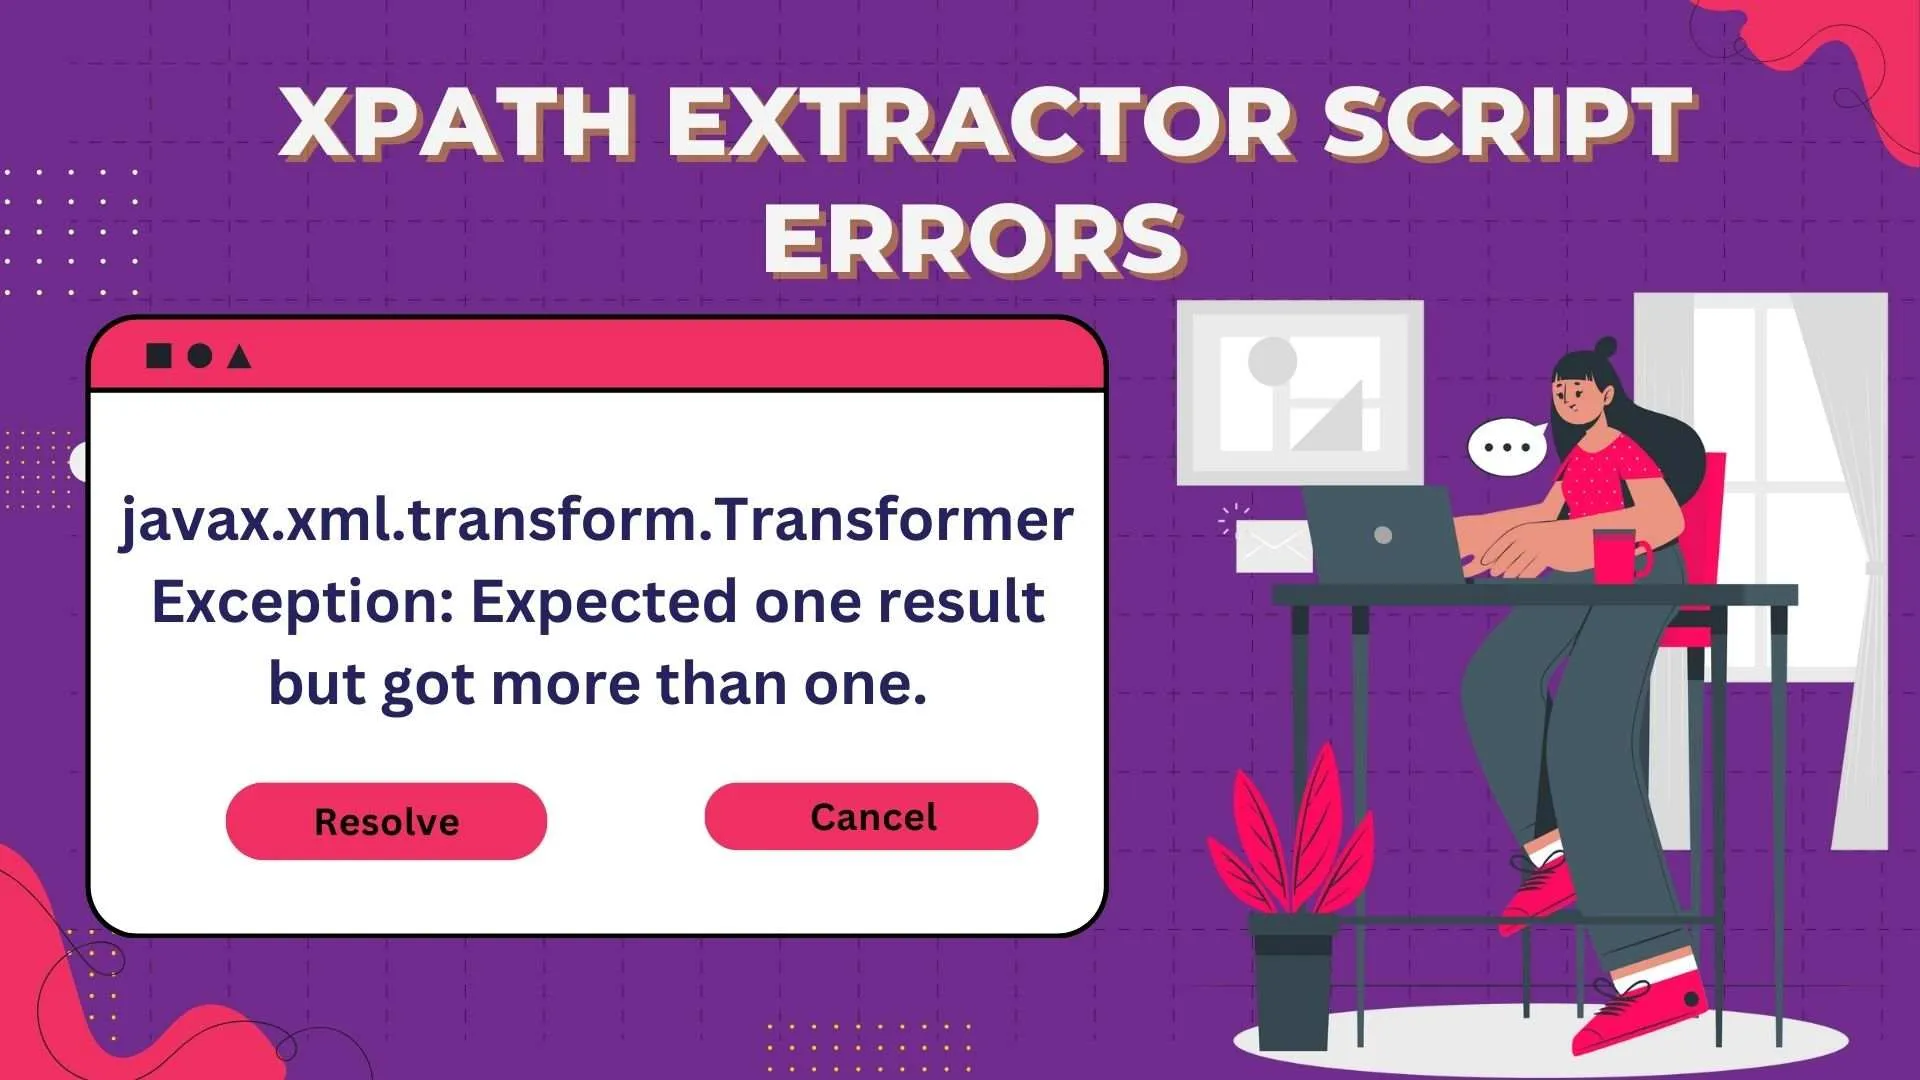
An error notice that appears like the following could appear to you.
javax.xml.transform.TransformerException: Expected one result but got more than one.To fix:
- Validate XPath syntax: Make sure test scripts' XPath expressions follow XPath standards by checking their syntax. To test expressions, use debugging tools or online XPath evaluators.
- Debugging script execution entails stepping through the script's execution to find any mistakes or inconsistent use of XPath expressions. Check that the desired elements in server responses are appropriately targeted by XPath expressions.
JDBC Sampler Script Errors
When JMeter has problems running JDBC queries in test scripts, JDBC sampler script errors happen.
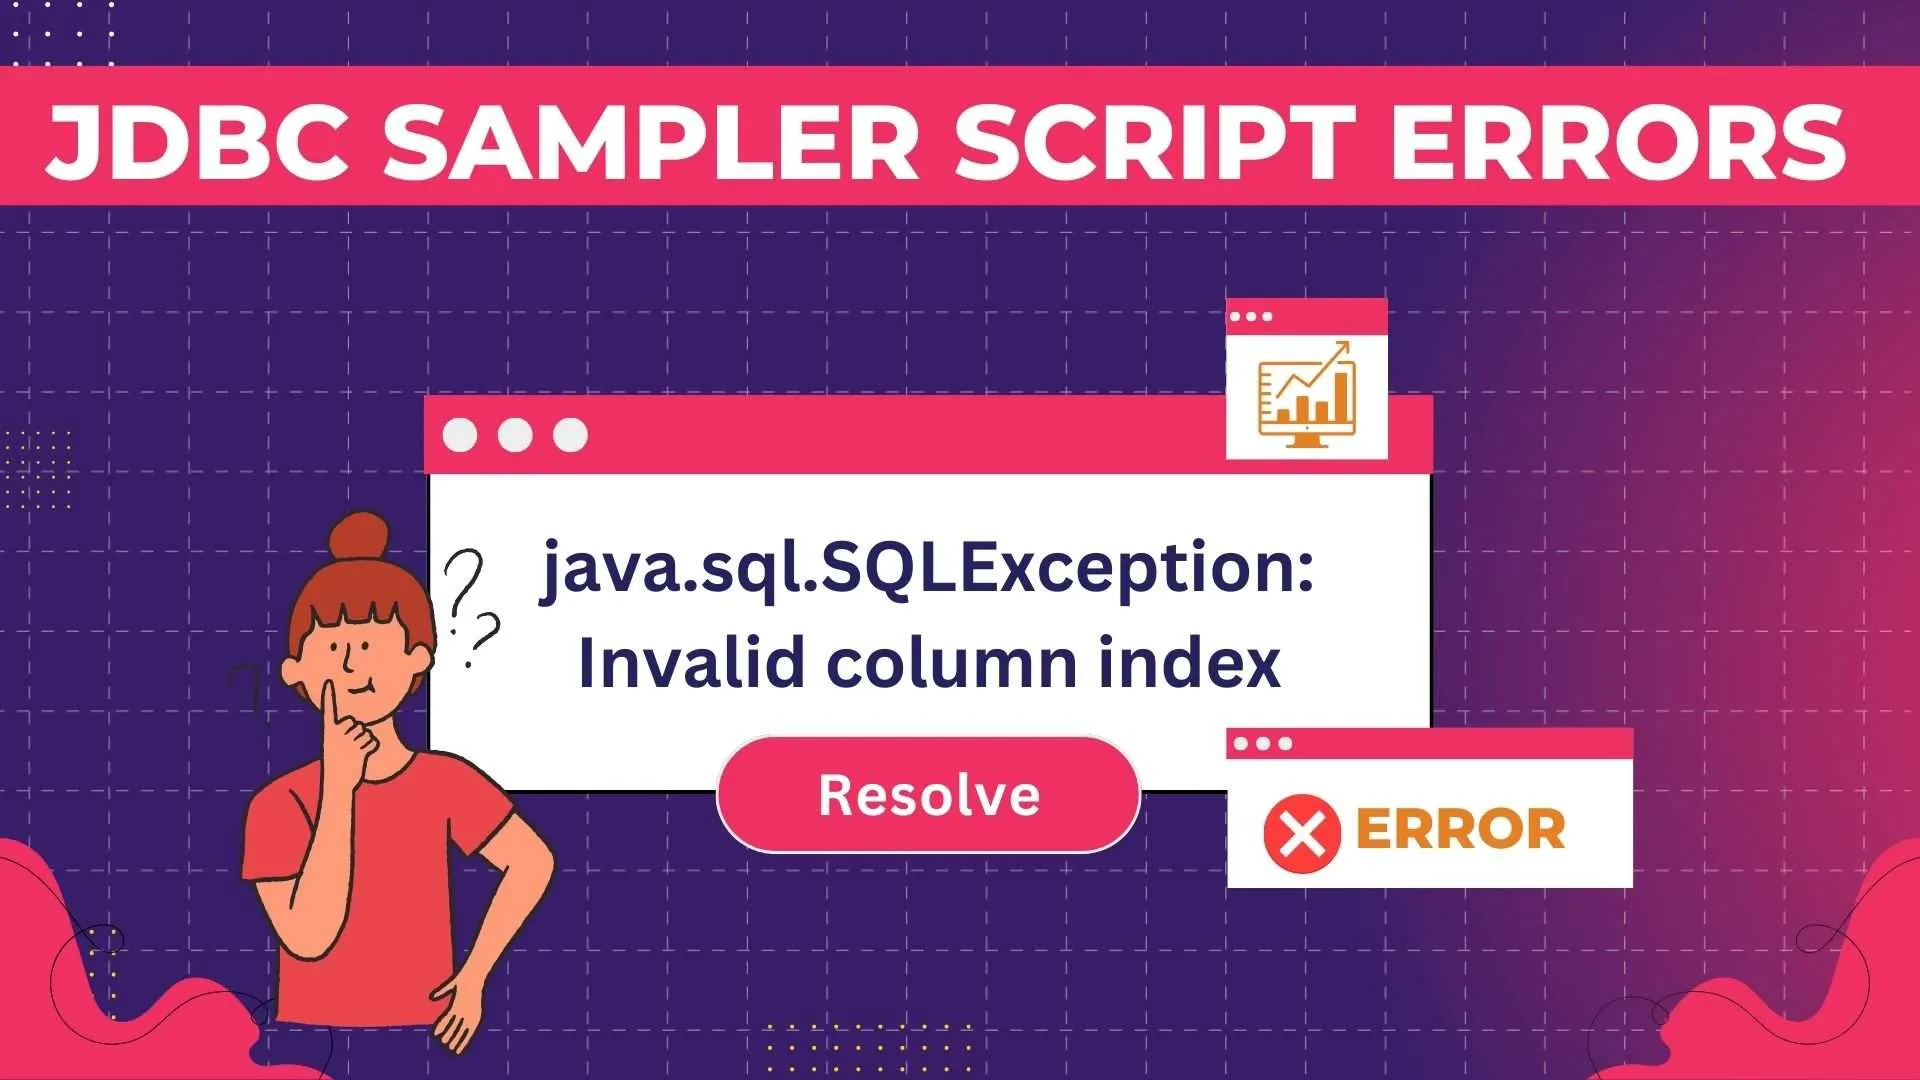
An error notice that appears like the following could appear to you
java.sql.SQLException: Invalid column indexTo fix:
- Examine SQL syntax: Verify that the SQL queries used in test scripts have the correct formatting and validity by checking their syntax. To validate queries, use database administration tools or SQL debugging tools.
- Check the JDBC setup: Make sure the ramp and JDBC connection settings in JMeter match by double-checking them.
Enhancing JMeter Performance
1. Utilizing Non-GUI Mode: Performance increases overall when tests are run without a GUI since resource overhead is much reduced. JMeter uses less resources whereas running tests without a graphical user interface, which makes the procedure run more quickly and smoothly.
2. Virtual Users: Scaling test scenarios and dividing the burden efficiently can be achieved by distributing the load among several JMeter instances. Users can gain more accurate performance insights and mimic bigger user numbers by utilizing multiple instances.
3. Optimizing Test Plans: Simplifying settings to reduce resource consumption is a key component of optimizing test strategies. This entails minimizing the usage of listeners, streamlining test logic whenever it can be done, and optimizing thread group settings. Through the removal of superfluous components and optimization of setups, users can attain increased performance without sacrificing test accuracy.
4.Monitoring System Resources: Finding any bottlenecks and improving performance during test execution need constant monitoring of system resources. Through vigilant observation of CPU, memory, and network utilization, users can identify resource limitations in advance and adopt preemptive actions to alleviate them. Performance testing results are more trustworthy and test execution runs more smoothly with this proactive method.
Top Troubleshooting Tips for JMeter
- Review Log Files Thoroughly: Examine JMeter's log files in detail to find any error messages or warnings. These are important traces that point to the source of the issue and help with creating appropriate solutions that are then documented in a bug report.
- Debug Incrementally and Systematically: Debug test plans incrementally to break down the troubleshooting process into smaller steps. Within the test plan, begin by isolating particular parts or components and carefully debug each one separately. This methodical approach reduces the possibility of unintentionally making pre-existing problems worse while also streamlining the troubleshooting process.
- Use Listeners Sparingly and Intelligently: Even though listeners provide priceless insights on how tests are carried out, their careless use might result in needless resource overhead and possibly lower performance. Use caution while choosing listeners, choosing just those who are necessary for the diagnosis procedure. Additionally, if listeners aren't actively helping to resolve issues, think about temporarily disabling or eliminating them.
- Keep JMeter and Java Versions Updated: Update Java and JMeter frequently to maintain security, stability, and compatibility. Keep up with the most recent patches and releases; new software frequently comes with security updates, performance improvements, and bug fixes. Users may take advantage of the newest features and enhancements while reducing known problems and vulnerabilities by keeping their software updated.
Best Practices for Error-Free Testing in JMeter
- Thorough Planning and Design: Update Java and JMeter frequently to maintain security, stability, and compatibility. Keep up with the most recent patches and releases; new software frequently comes with security updates, performance improvements, and bug fixes. Users may take advantage of the newest features and enhancements while reducing known problems and vulnerabilities by keeping their software updated.
- Utilize Parameterization and Correlation Techniques: Through the dynamic substitution of values in test components made possible by parameterization, a variety of user inputs and scenarios can be simulated. In order to reuse dynamic data obtained from server answers in later requests, correlation techniques are helpful. Testers can improve the accuracy and dependability of test findings by using these strategies to generate more robust and realistic test situations.
- Regular Maintenance of Test Scripts: As applications change over time, test scripts often become antiquated or ineffective. Make routine test script maintenance a top priority in order to reduce this danger. Periodically review and update scripts to reflect modifications to user interfaces, performance needs, or application functionality. Regression testing should also be done thoroughly to confirm script integrity and spot possible problems early on.
- Collaborate with Development and Operations Teams: To understand application behavior and performance needs, and encourage cooperation between the development, operations, and testing teams. To be aware of impending modifications or improvements to the application design, infrastructure, or business logic, communicate proactively. Teams can anticipate problems and take proactive measures to address them by utilizing their pooled skills and subject knowledge. This promotes a collaborative and continuous development culture.
Further Resources for JMeter and Performance Testing
- Apache JMeter documentation
- JMeter Load Testing: A Comprehensive Guide
- Ultimate Guide to JMeter Performance Testing
- Performance Testing with JMeter 3 by Bayo Erinle
- Pro Apache JMeter: Web Application Performance Testing By Sai Matam and Jagdeep Jain.
Here's a brief summary of the topics we discussed:
Although JMeter is a useful tool for performance testing, it has its own share of problems like any other software.
This blog post addressed common issues that you can encounter, like memory exceptions, script errors, and server resource limitations. By following the recommended troubleshooting steps and best practices, you may effectively resolve these problems and ensure error-free test execution.
The materials provided contain more guidance on using JMeter and performance testing. You should be able to confidently detect and fix JMeter issues after reading this article, which will result in accurate performance testing results.
People also Asked
👉🏻What Type of Application Cannot be Tested Using JMeter?
Although JMeter can be used for other protocols, its primary purpose is to test web applications. It might not be appropriate, nevertheless, for testing proprietary protocols or very complicated logic applications.
👉🏻How Can We Improve the Performance of JMeter?
While testing, disperse the load, keep an eye on system resources, and optimize test strategies. Make use of JMeter best practices and adhere to suggested standards.
👉🏻How Can We Reduce Latency in JMeter?
Run JMeter instances closer to the server being tested to reduce network latency. Test scripts should be optimized to cut down on needless wait times and delays.
👉🏻How Can We Increase the JVM Size in JMeter?
Increase the heap space allotted to JMeter by modifying the `jmeter.bat` or `jmeter.sh` file and changing the `-Xms` and `-Xmx} parameters.
👉🏻How Can We Identify and Fix Logic Errors in JMeter Test Plan?
Examine assertions, debug test scripts, and work with developers to find and fix logical mistakes. Test and validate each test plan component incrementally.
👉🏻Where can I find the output files generated by JMeter for details on test results?
The JTL/CSV files that configured Listeners (Tree/Table) save contain the results of JMeter tests.


%201.webp)

